
Figure 2. Microglia Hyper-proliferation and Induction of Lysosomal Genes in TSC1Cx3cr1CKO Mouse Brains.
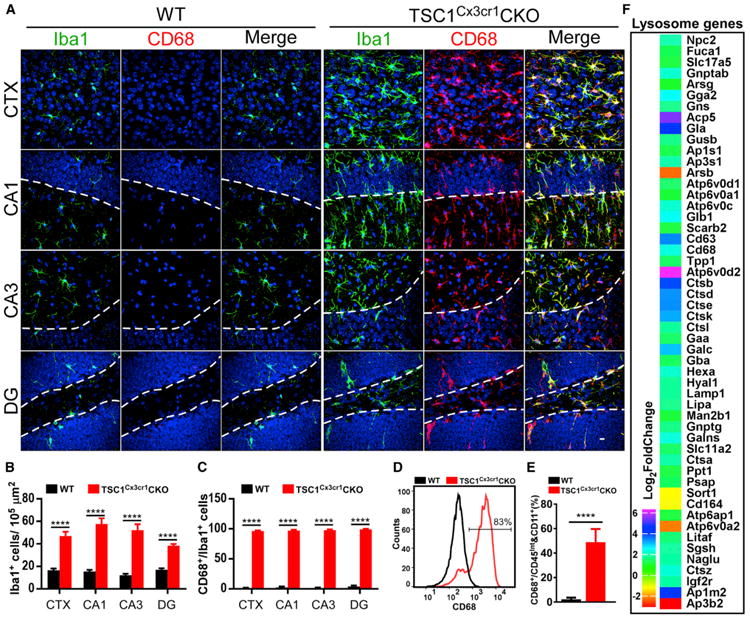
(A) Confocal images acquired from CTX, CA1, CA3, and DG of WT and TSC1Cx3cr1CKO mouse brains. Scale bar, 10 μm.
(B and C) Quantification of Iba1-positive (B) and Iba1/CD68 double-positive (C) microglia in WT (n = 6; 3 males and 3 females) and TSC1Cx3cr1CKO (n = 7; 3 males and 4 females) mice.
(D) FACS analysis of CD68 expression in microglia prepared from WT and TSC1Cx3cr1CKO mouse brains.
(E) Quantification of the CD68-positive cell population in WT (n = 5; 2 males and 3 females) and TSC1Cx3cr1CKO (n = 5; 2 males and 3 females) mice. Data are presented as mean ± SEM (t test). ****p < 0.0001. See also Figure S2.
(F) Analysis of RNA-seq data using the iPathwayguide program revealed altered expression of lysosomal genes in TSC1Cx3cr1CKO microglia (log2 fold change compared to control). Data were from four sets of microglial preparations. p value (padj) < 0.05.