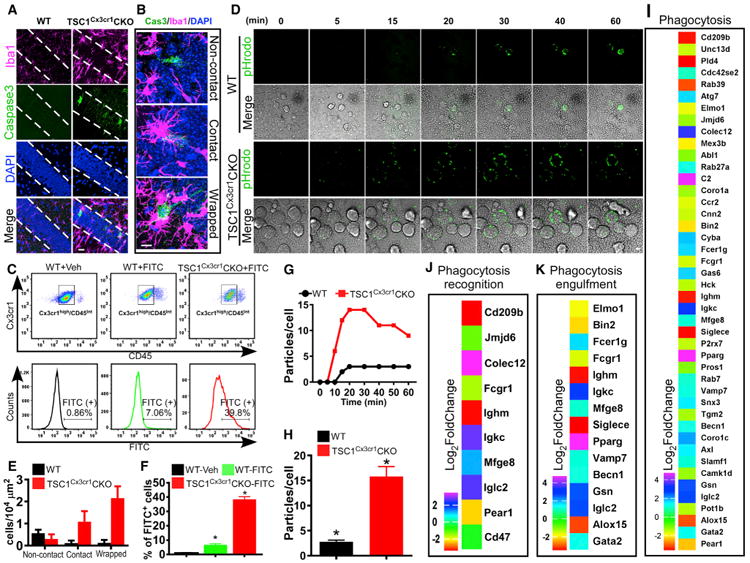
Figure 3. TSC1Cx3cr1CKO Microglia Display Increased Phagocytosis Activity.

(A) Dying neurons in hippocampal CA1 in TSC1Cx3cr1CKO mice were identified by anti-activated caspase-3 antibody. Scale bar, 20 μm.
(B) Representative high-magnification images showing that dying (activated caspase-3 positive) neurons were isolated, had brief contact with a microglial cell, or were enwrapped by a microglia. Scale bar, 10 μm.
(C) FACS analysis of in vivo phagocytosis of FITC-labeled zymosan particles. The microglial population was identified as CD11b+/Cx3Ce1high/CD45 low/Int cells.
(D) Representative images from in vitro live-imaging of microglia phagocytosis of pHrodo Green zymosan bioparticles. Scale bar, 10 μm.
(E) Quantification of activated caspase-3-positive neurons in CA1 that fall within one of three categories: non-contact, contact, and wrapped. Data were averaged from WT (n = 6; 3 males, 3 females) and TSC1Cx3cr1CKO mice (n = 7; 3 males and 4 females).
(F) Quantification of FITC-positive microglia in the groups of WT- Vehicle (n = 3; 1 male and 2 females), WT- FITC (n = 3; 2 males and 1 female), and TSC1Cx3cr1CKO-FITC (n = 3; 1 male and 2 females) mice.
(G) Representative time course showing the number of phagocytic bioparticles over time.
(H) Average particles per microglia at the 30-min time point (n = 4–6). Data are presented as mean ± SEM (t test). *p < 0.05. See also Figure S3.
(I–K) Analysis of RNA-seq data revealed changes in expression of genes implicated in phagocytosis (I), phagocytosis recognition (J), and phagocytosis engulfment (K) in TSC1Cx3cr1CKO microglia (log2-fold change compared to control). p values (padj) < 0.05.
