
Figure 4. Impact of Deletion of TSC1 in Microglia on Production of Cytokines, Chemokines, and Other Inflammatory Mediators.
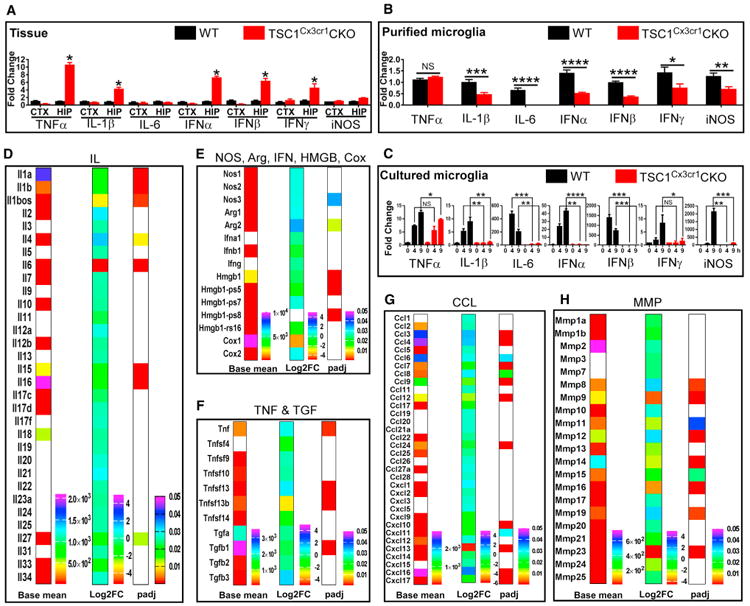
(A) qRT-PCR analysis of cytokine expression in cortical and hippocampal tissues of WT (n = 3; 2 males and 1 female) and TSC1Cx3cr1CKO (n = 3; 2 males and 1 female) mice.
(B) Cytokine expression in purified microglia from control (n = 3; 2 males and 1 female) and TSC1Cx3cr1CKO (n = 3; 2 males and 1 female) mice (n = 3). See also Figures S5B–S5E.
(C) Cytokine expression in cultured microglia prepared from control and TSC1Cx3cr1CKO mice (n = 4-5). Data are presented as mean ± SEM (t test). NS, not significant; *p < 0.05, **p < 0.01, ***p < 0.001, and ****p < 0.0001.
(D–H) Heatmap plot of the expression of IL (D), NOS, Arg, IFN, HMGB, and Cox (E), TNF and TGF (F), CCL (G), and MMP (H). Plot showing basal levels of gene expression in control microglia (Basemean), fold changes (log2FC) in TSC1Cx3cr1CKO microglia, and p values (padj) to evaluate the significance of the changes. Non-color-filled spaces indicate expression was either undetectable or padj value > 0.05. See also Figure S4.