
Figure 2.
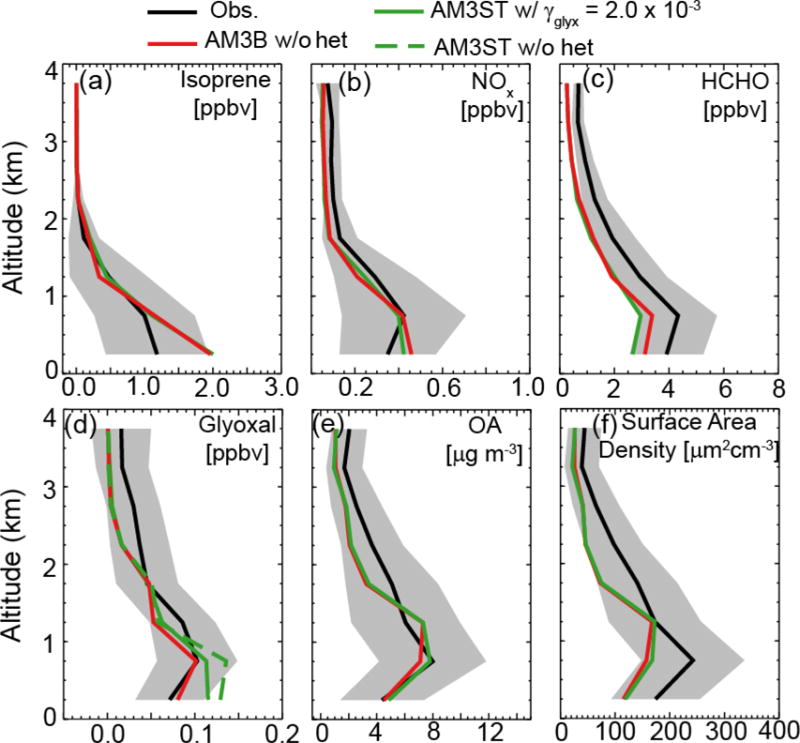
Mean vertical profiles of isoprene, formaldehyde, NOx, glyoxal, organic aerosol (OA) and surface area density of aerosol during SENEX. Grey shades are the standard deviation (σ) of the averaged profiles of the measured tracers. Dashed green line in panel (d) is model estimate without heterogeneous loss of glyoxal by AM3ST. Observed organic aerosol mass and aerosol surface area density are from dry particles.