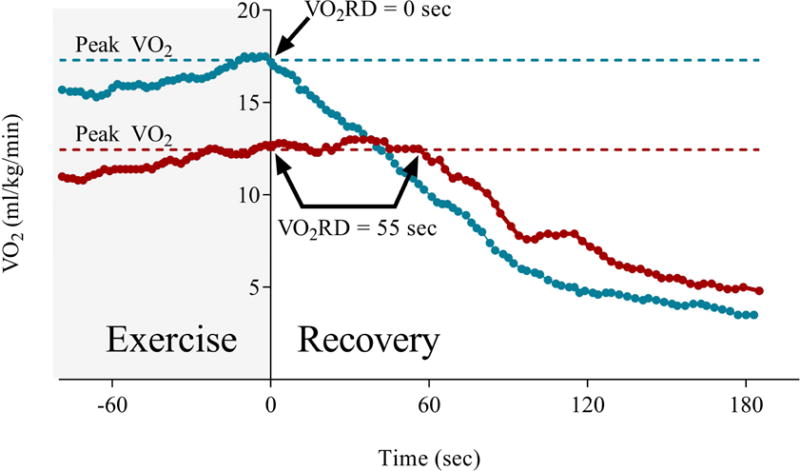
Figure 1. Defining VO2 recovery delay.

This illustration contains data from two patients with heart failure who demonstrate distinct patterns of VO2RD. The gray area illustrates the final portion of incremental ramp exercise. VO2RD was defined as the duration of time from end exercise until the time when oxygen consumption (VO2) fell permanently below peak VO2 (dashed lines). The blue line represents a patient who has an immediate decrement in VO2 following completion of the exercise period (shaded in gray) with a resultant VO2RD value of 0 seconds. In contrast, the second patient’s VO2 (red line) remained at values at or above those achieved at peak exercise for 55 seconds after exercise before beginning to decline.
