
Figure 4. Prolonged VO2 recovery delay is associated with reduced VO2/work slope.
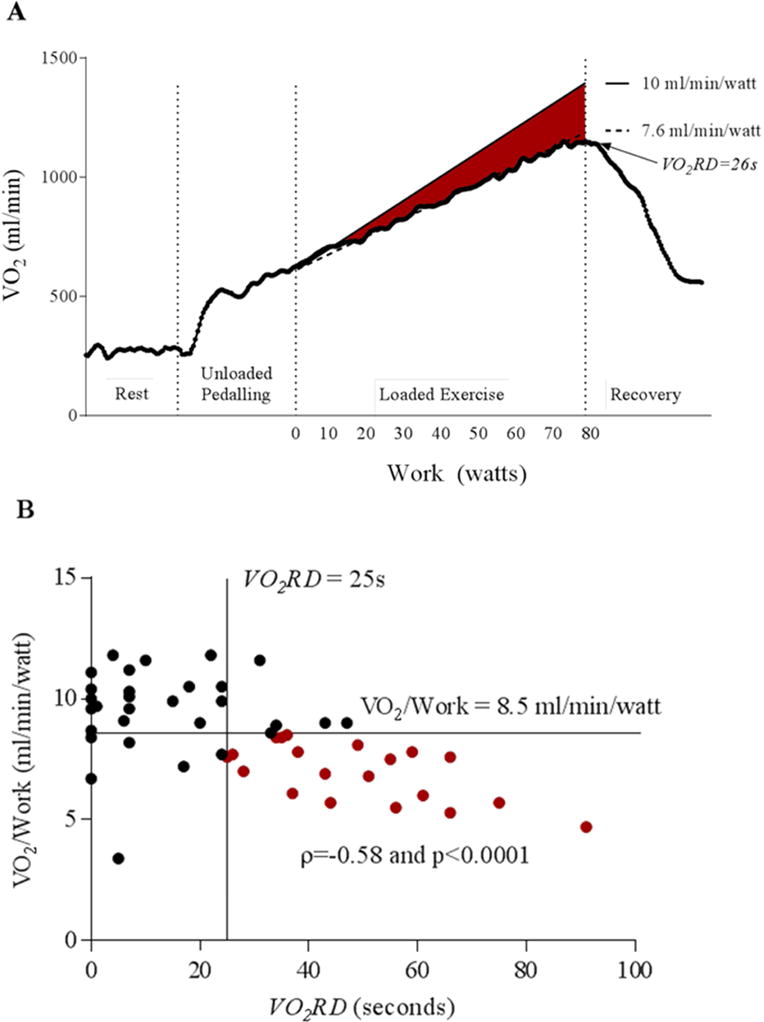
A) Oxygen uptake plotted against workload during progression of an exercise test in a representative patient with HF and a prolonged VO2RD of 26s. The red area highlights the difference between normal VO2/work (10 ml/min/watt) and the subject’s reduced VO2/work of 7.6 ml/min/watt, which represents an O2 deficit at the tissue. B) A scatter plot of VO2/work versus VO2RD for the combined HF group (n=50). Spearman rank correlation is included. The HF patients with prolonged VO2RD and abnormal VO2/work (< 8.5 mL/watt) are denoted in red (n=20 of 25 with prolonged VO2RD)