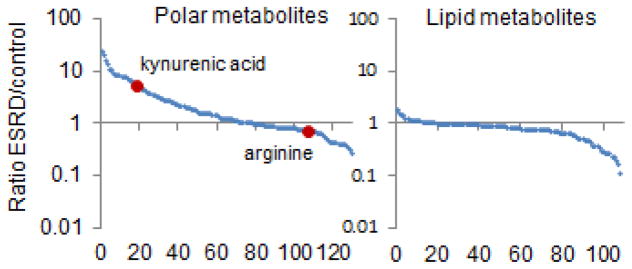
Figure 2. ESRD is a State of Small Molecule Disarray.
Mean ratio in peripheral plasma of ESRD patients versus control for ~220 metabolites, with polar (left) and lipid (right) metabolites shown separately. Metabolites are ordered from left to right on the x-axis from highest to lowest ratio. Two representative metabolites, kynurenic acid and arginine are highlighted.

