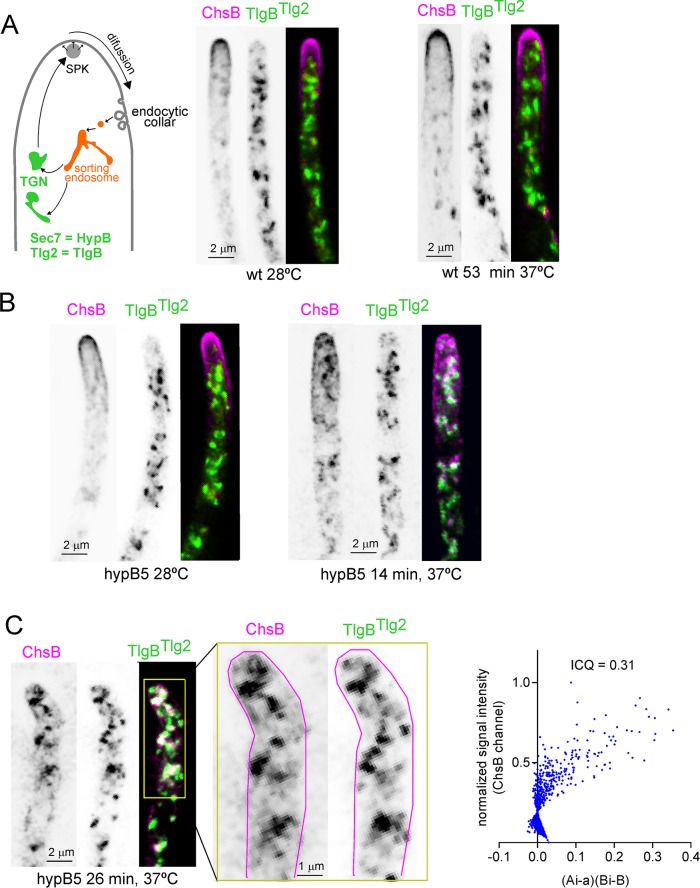
Fig 7. A hypB5 (= sec7ts) mutation strands ChsB in the TGN.
(A) Images of a wt strain co-expressing mCh-ChsB and GFP-TlgB cultured at 28°C and following a shift to 37°C. (B) Images of the corresponding hypB5 strain before and 14 min after the temperature shift. (C) The hypB5 mutant at a later time-point. Right graph, plot of Li’s intensity correlation coefficient (ICQ) used to estimate colocalization. ‘Ai’ and ‘a’ are the ChsB channel’s current and mean intensity, whereas ‘Bi’ and ‘b’ indicate the same values for the TlgBTlg2 channel. Colocalization results in a pixel cloud spread on the right side of the plot. ICQ ranges from −0.5 (exclusion) to 0.5 (complete colocalization). All images are MIPs of deconvolved z-stacks.

