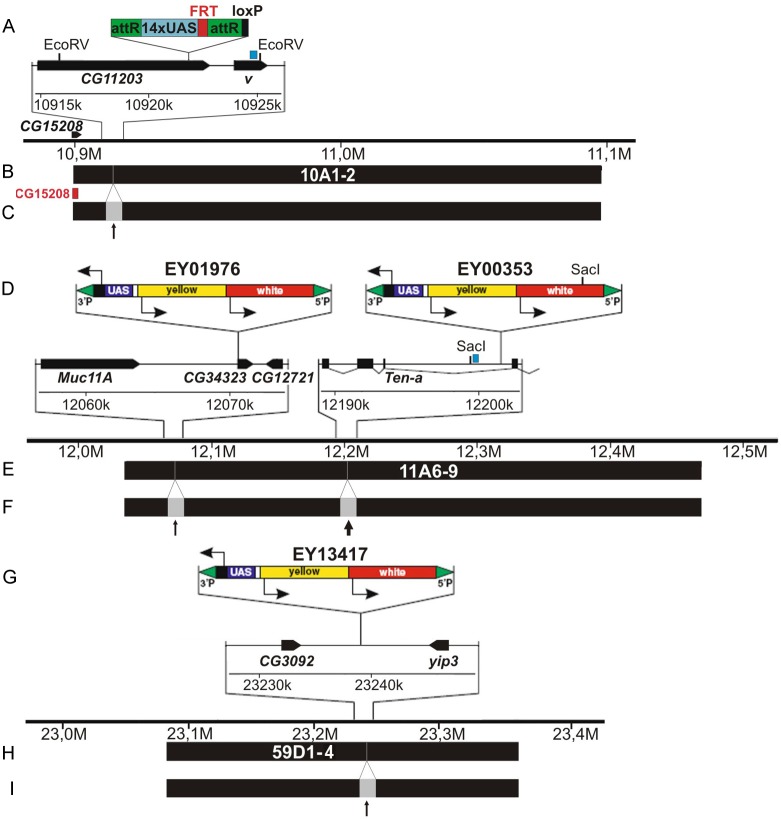
Fig 1. Molecular maps of the genomic regions surrounding the insertions of UAS-bearing transgenes at 10A1-2 (A-C), 11A6-9 (D-F), and 59D1-4 (G-I).
A, D, G—organization of 10A-UAS, EY01976, EY00353, and EY13417 transposons and adjacent genes. EcoRV and SacI are the restriction sites used for mapping DHSes in 10A1-2 and 11A6-9 regions, respectively. B, E, H—span of the bands 10A1-2, 11A6-9, 59D1-4 and positions of UAS insertions. C, F, I—schematic illustration of how the bands are expected to split in two fragments separated by an interband (thick and thin arrows) as a result of local CHRO or dCTCF tethering. Red block denotes a fragment of CG15208 gene used for FISH analysis (C).

