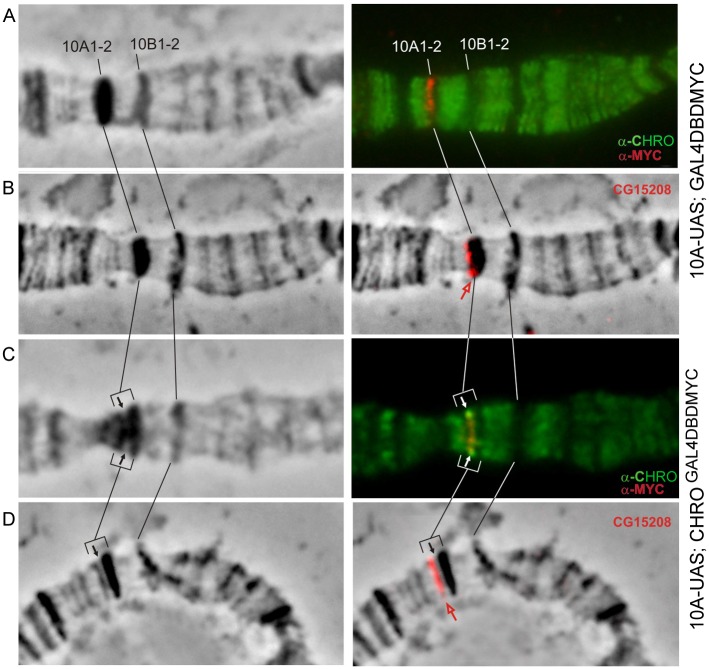
Fig 2. 10A1-2 band splits upon CHROGAL4DBD tethering.
Phase contrast (left column). Overlay of phase contrast and immunostaining (A, C) or FISH (B, D) signals (right column). Black and white arrows point to the tethering region, red arrow indicates the position of CG15208 on the edge of band in control chromosomes (B) or in the distal fragment that has split from 10A1-2 upon tethering (D). CHRO (green), MYC (red), FISH signal (red).

