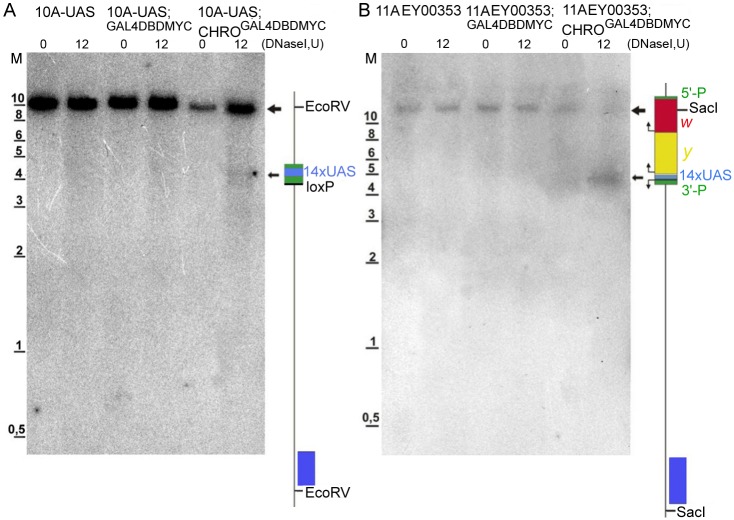
Fig 8. DHS mapping in the UAS region within the bands 10A1-2 and 11A6-9.
(A) Southern-blot hybridization data for the probe from the region 10A1-2 with the EcoRV-treated DNA isolated from DNaseI-digested (0 U and 12 U) nuclei from third-instar larvae of the following genotypes: 10A,UAS; 10A,UAS GAL4DBD-MYC; and 10A,UAS CHROGAL4DBD. Map of the 10.3 kb EcoRV fragment encompassing the 14xUAS cassette integrated in the region 10A1-2 is shown on the right. (B) Southern-blot hybridization data for the probe from the region 11A6-9 with the SacI-treated DNA isolated from DNaseI-digested (0 U and 12 U) nuclei from third-instar larvae of the following genotypes: EY00353; EY00353 GAL4DBD-MYC; and EY00353 CHROGAL4DBD. Map of the 12,3 kb fragment encompassing part of the EY transposon and adjacent genomic DNA. Large arrows point to the hybridization signals corresponding to the full-length EcoRV-fragment from the region 10A1-2 and to the SacI-fragment from the region 11A6-9; small arrows indicate the DHSes detectable in the regions of interest upon expression of chimeric proteins and mapping to the 14xUAS module. Positions of the probes used for indirect-end labeling are shown as blue bars. M—molecular weight marker (kb).

