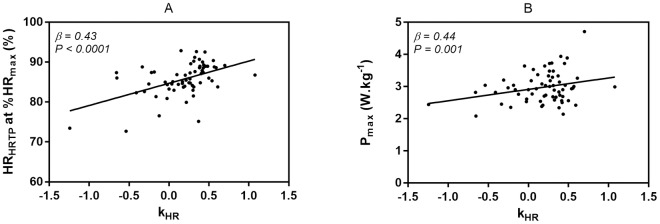
Fig 4. Single plots of the association of kHR and HRHRTP at %HRmax (A) and Pmax (B).
kHR = degree and direction of the heart rate to performance curve, HRHRTP at %HRmax = heart rate at the heart rate turn point given as percentages of the maximum heart rate, Pmax = maximum power output relativized to bodyweight.

