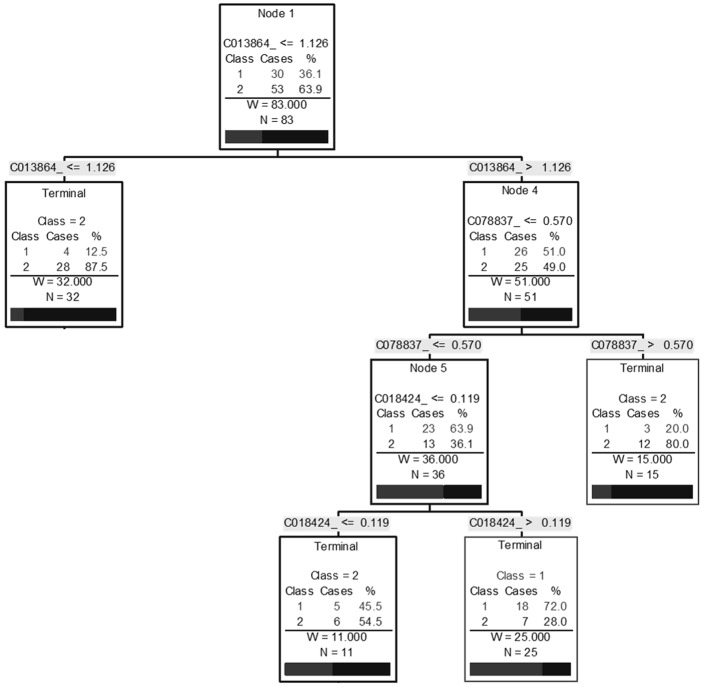
Fig 4. Decision tree to differentiate non-fibrotic individuals (F1) from individuals with significant fibrosis (F2 and above) in HIV/HCV co-infection using known biomarkers.
A biomarker pattern based on CART analysis was used to generate candidate diagnostic algorithms. The numbers in the root node, the descendant nodes and the terminal nodes represent mass values (Cxxxxxx) followed by intensity values. Class 1: non-fibrotic individuals, Class 2: individuals with significant fibrosis.

