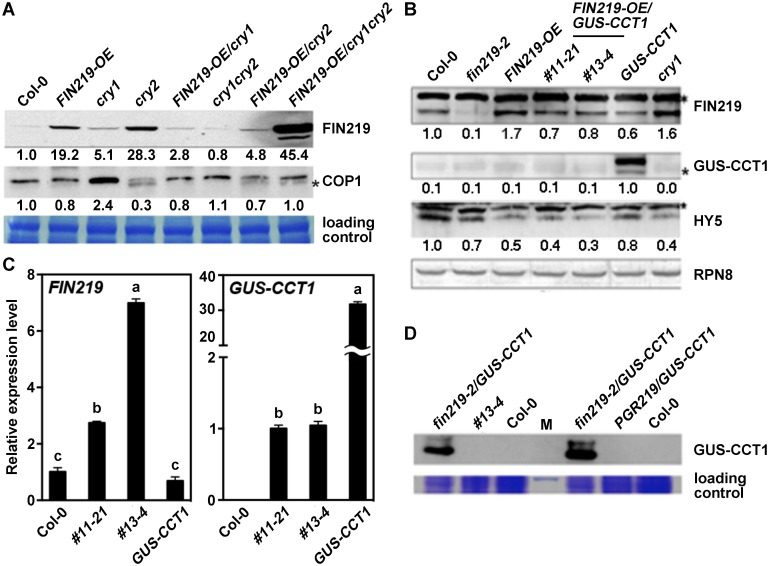
Fig 2. FIN219 and CRY1 antagonize each other under blue light.
(A) CRY1 and CRY2 negatively regulate FIN219 protein level under blue light. Western blot analysis of FIN219 protein level in wild-type Col-0, cry1, cry2 mutants and transgenic seedlings grown under blue light. The signal was detected by FIN219 monoclonal antibody. Blue light: 2.2 μmol•m-2•s-1. The number below each blot represents the level of the indicated protein. The level of wild-type Col-0 was arbitrarily set to 1. The asterisk (*) indicates nonspecific bands. (B) FIN219 overexpression in GUS-CCT1 seedlings abolishes GUS-CCT1 fusion protein in blue light. Western blot analysis of protein levels in Col-0, fin219-2, FIN219 overexpression line (FIN219-OE), FIN219-OE/GUS-CCT1, GUS-CCT1 and cry1 seedlings grown in blue light for 3 days. The blots were detected by antibodies against FIN219 and GUS-CCT1 and HY5. Blue light: 2.2 μmol•m-2•s-1. RPN8 was a loading control. The asterisk (*) indicates nonspecific bands. The number below each blot represents the level of the indicated protein. The level of wild-type Col-0 was arbitrarily set to 1. (C) GUS-CCT1 transcripts detected in transgenic seedlings of FIN219-OE/GUS-CCT1 under blue light. Quantitative Real-time PCR (qPCR) analysis of transgenic seedlings shown in B. Total RNAs were extracted from transgenic seedlings shown in the figure and subjected for qPCR analysis. Ubiquitin 10 (UBQ10) was an internal control. (D) GUS-CCT1 fusion proteins were stable in fin219-2/GUS-CCT1 seedlings under blue light. Western blot analysis of GUS-CCT1 level in Col-0, FIN219-OE/GUS-CCT1 (#13–4), fin219-2/GUS-CCT1 and PGR219/GUS-CCT1 seedlings grown in blue light for 4 days. Total proteins extracted from seedlings were probed with GUS antibody. M, protein size markers.

