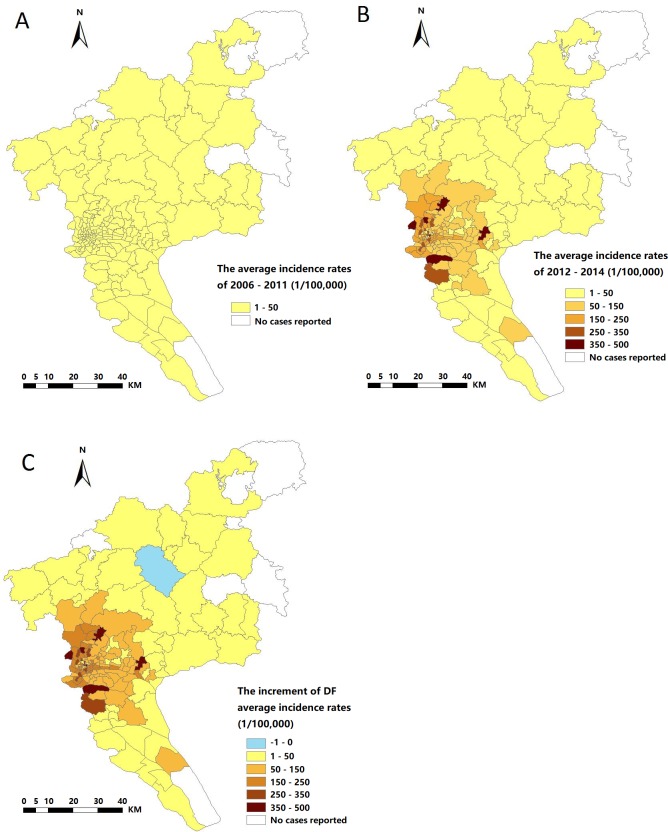
Fig 3. The average DF incidence rates and increment of average DF incidence rates.
A, B, &C were generated by ArcGIS 10.0 (Environmental Systems Research Institute, RedLands, California, U.S.A.). The spatial distributions for annual mean DF incidence rates during 2006±2011; (B) The spatial distributions for annual mean DF incidence rates during 2012±2014; (C) The spatial distribution for increment of annual mean DF incidence rates from 2006±2011 to 2012±2014.

