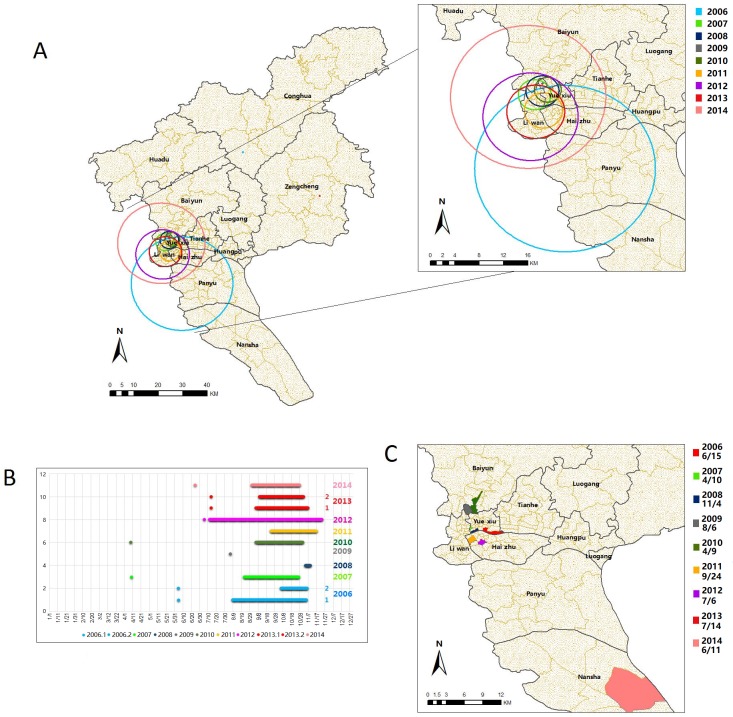
Fig 5. The spatial and temporal clusters of daily indigenous DF cases in Guangzhou city, 2006–2014.
A&C were produced by ArcGIS 10.0 (Environmental Systems Research Institute, RedLands, California, U.S.A). (A) Spatial cluster circles of each year produced by SaTScan were displayed in different color. Both the most likely cluster and the secondary subcluster were displayed. Only the most likely clusters were displayed in the enlarged map. (B) Time clusters of each significant cluster of each year were plotted by different color and a dot in the earliest date denote the date of the onset of the first case of each year. In the year 2006 and 2013, “1” is the most likely cluster and “2” is the secondary likely cluster. (C) The streets where the first cases occur were plotted in different color and the date of onset were labeled below the legend.

