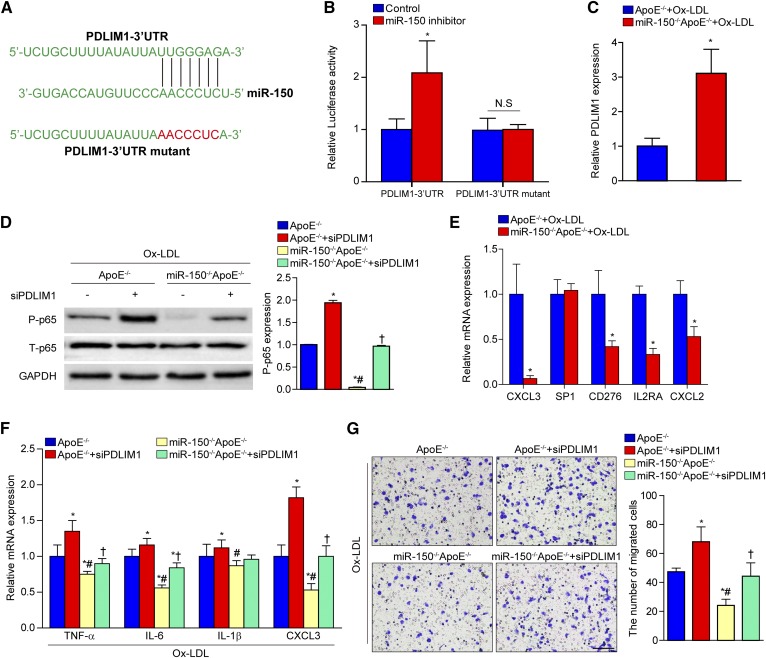
Fig. 7.
The upregulation of PDLIM1 expression by miR-150 deficiency. A: Potential target sites for miR-150 in the 3′UTR of murine PDLIM1 mRNA (blue). The sequence in the binding region that is highlighted in red was mutated. B: Luciferase reporter assays in HEK293 cells treated with a miR-150 inhibitor or negative control using a pEZX-MT01 vector containing the PDLIM1-3′UTR or the PDLIM1-3′UTR with mutations in the predicted miR-150 binding site. *P < 0.05 versus control group. C: qPCR analysis of PDLIM1 expression in BMDMs from miR-150−/−ApoE−/− or ApoE−/− mice stimulated with Ox-LDL. *P < 0.05 versus the ApoE−/− group. D: Western blot analysis of phosphorylated p65 (P-p65) expression levels in BMDMs from miR-150−/−ApoE−/− or ApoE−/− mice transfected with control or PDLIM1-specific siRNAs before Ox-LDL treatment. *P < 0.05 versus the ApoE−/− group; #P < 0.05 versus the ApoE−/− group treated with PDLIM1-specific siRNA; †P < 0.05 versus the miR-150−/−ApoE−/− group. E: qPCR analysis of the expression of potential target genes in BMDMs from miR-150−/−ApoE−/− or ApoE−/− mice stimulated with Ox-LDL. *P < 0.05 versus the ApoE−/− group. F: Inflammatory cytokine mRNA expression in BMDMs from miR-150−/−ApoE−/− or ApoE−/− mice pretreated with control or PDLIM1-specific siRNA before Ox-LDL treatment. *P < 0.05 versus the ApoE−/− group; #P < 0.05 versus the ApoE−/− group treated with PDLIM1-specific siRNA; †P < 0.05 versus the miR-150−/−ApoE−/− group. G: Macrophage infiltration ability was tested with transwell assays and crystal violet staining. *P < 0.05 versus the ApoE−/− group; #P < 0.05 versus the ApoE−/− group treated with PDLIM1-specific siRNA; †P < 0.05 versus the miR-150−/−ApoE−/− group. Scale bar = 100 μm.

