Fig. 3.
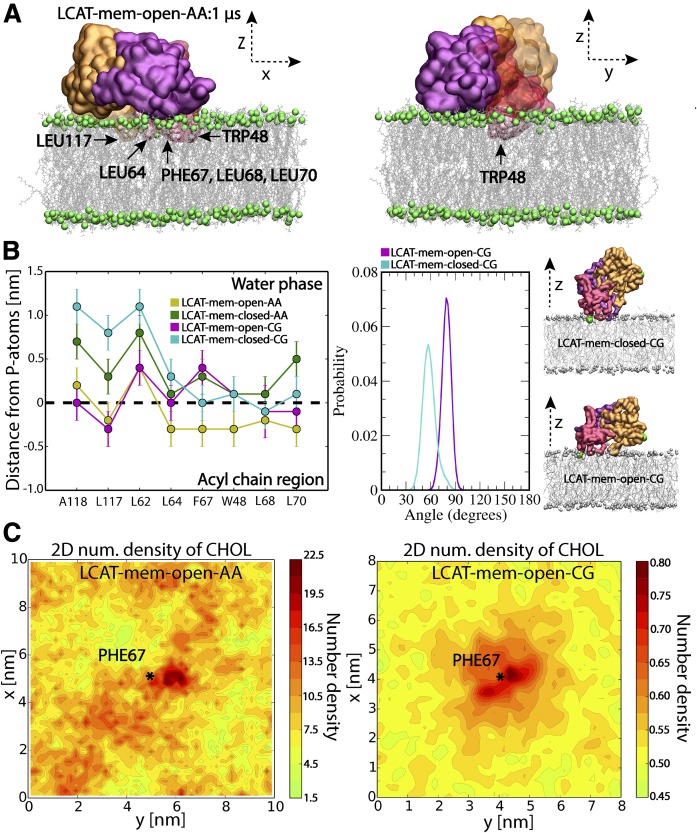
A: Snapshots from the end of LCAT-mem-open-AA simulation (1 μs). The coloring of LCAT domains is the following: orange is the α/β hydrolase domain, purple the cap domain, and red the membrane-binding domain. Gray sticks represent DOPC molecules and green spheres phosphorous atoms of DOPC. Water molecules have been removed from the snapshots for clarity. The membrane-penetrating hydrophobic residues of LCAT are marked and labeled to the snapshots. B: The average center of mass distances from the phosphorous atoms of DOPCs for the lipid-buried nonpolar amino acids in the lid-open and lid-closed membrane simulations (left); the average tilt angle of LCAT with respect to the normal of lipid membrane in LCAT-mem-open-CG and LCAT-mem-closed-CG simulations (right). In addition, snapshots approximating the average tilt angle in each case are shown. Coloring is the same as in A, but the tilt vector forming amino acids (ASN131 and MET49) has been marked with green spheres. C: The 2D-number density maps for UC in LCAT-mem-open-AA and LCAT-mem-open-CG simulations. The center of mass of PHE67 is marked by a star showing the location of the membrane-penetrating region of LCAT.

