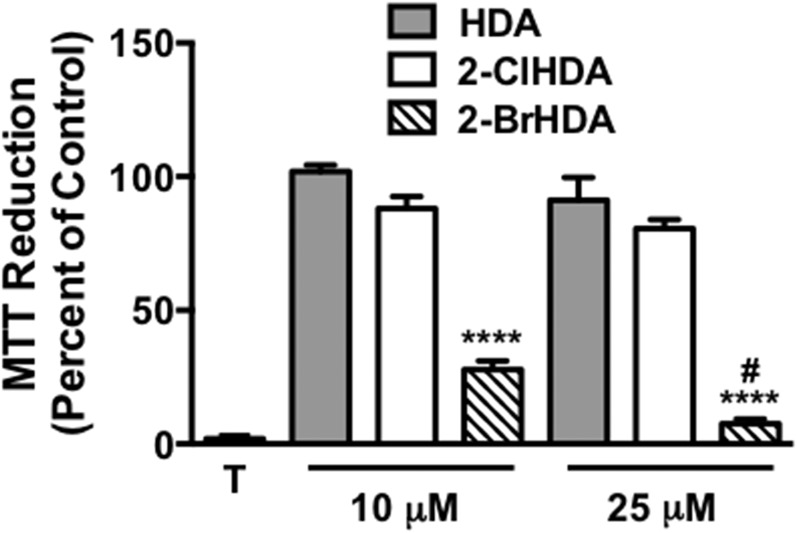
Fig. 8.
Disparate effect of 2-BrHDA and 2-ClHDA on THP-1 cell metabolic activity. THP-1 cells were treated with the indicated concentrations of either HDA, 2-ClHDA, or 2-BrHDA for 2 h at 37°C. Metabolic activity of HCAEC was measured using an MTT assay following the manufacturer’s protocol. MTT reduction is expressed as percent of control MTT reduction (vehicle only, designed as 100%). Data are expressed as mean ± SEM; n = 4 for each treatment. T indicates treatment of THP-1 cells with Triton X-100. #P < 0.05 for comparisons between 2-BrHDA at the two concentrations examined. ****P < 0.0001 for comparisons between 2-BrHDA and either 2-ClHDA or HDA at the indicated concentrations.

