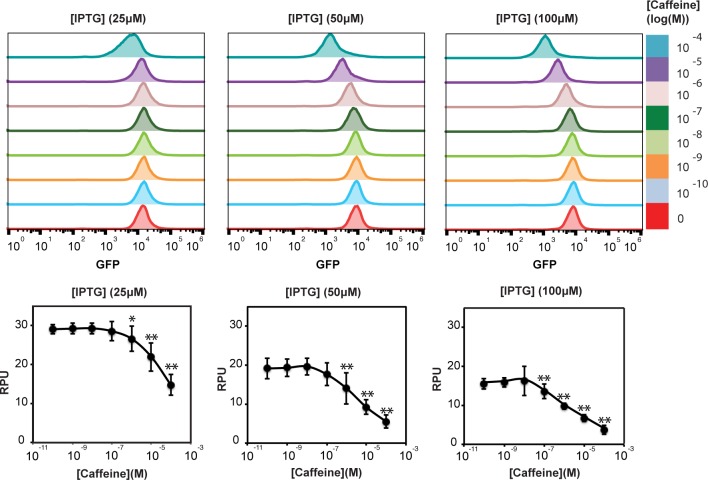
Figure 2.
Response of LexA-VHH-Caffeine to increasing concentrations of caffeine at 25, 50, and 100 μM IPTG induction. Upper panel: flow-cytometry data of LexA-VHH-Caffeine response to caffeine at different expression level. Lower panel: titrations curves of LexA-VHH-Caffeine in response to increasing concentrations of caffeine and at different expression level. Error bars: standard deviation between three independent experiments performed in triplicate. *p < 0.05, and **p < 0.01, compared with signal in the absence of caffeine.

