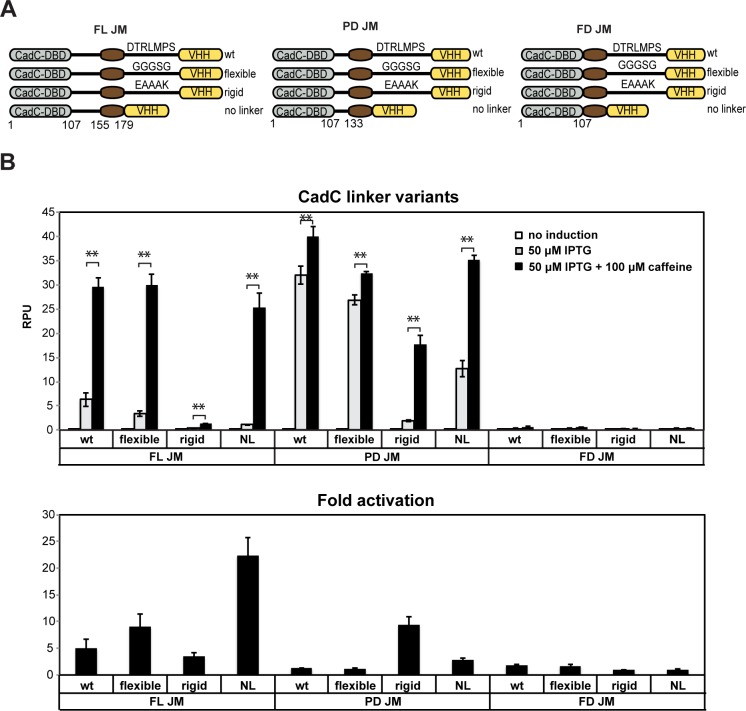
Figure 5.
Optimizing transmembrane receptor signal-to-noise ratio through linker engineering. (A) Schematic diagram of the 12 receptor variants tested. (B) Quantification of the response of 12 receptor variants to 100 μM caffeine upon 50 μM IPTG induction. Error bars: standard deviation between three independent experiments performed in triplicate. *p < 0.05, and **p < 0.01, compared with signal in the absence of caffeine.

