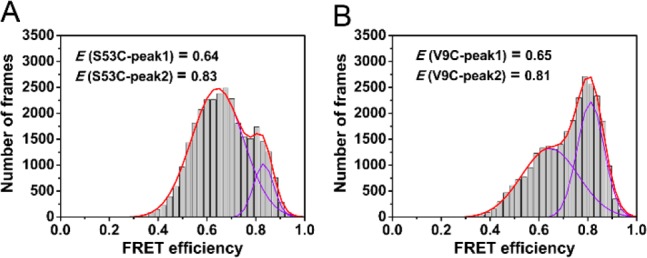
Figure 4.

Single molecule TIRF measurements of disaggregated fibrils. (A,B) SmFRET distribution histogram of Ure2 oligomers disaggregated from AF488/AF647-labeled fibrils. Data were fitted to a double Gaussian function (continuous line) to obtain the FRET values of the two species. (A) Ure2-S53C. (B) Ure2-V9C.
