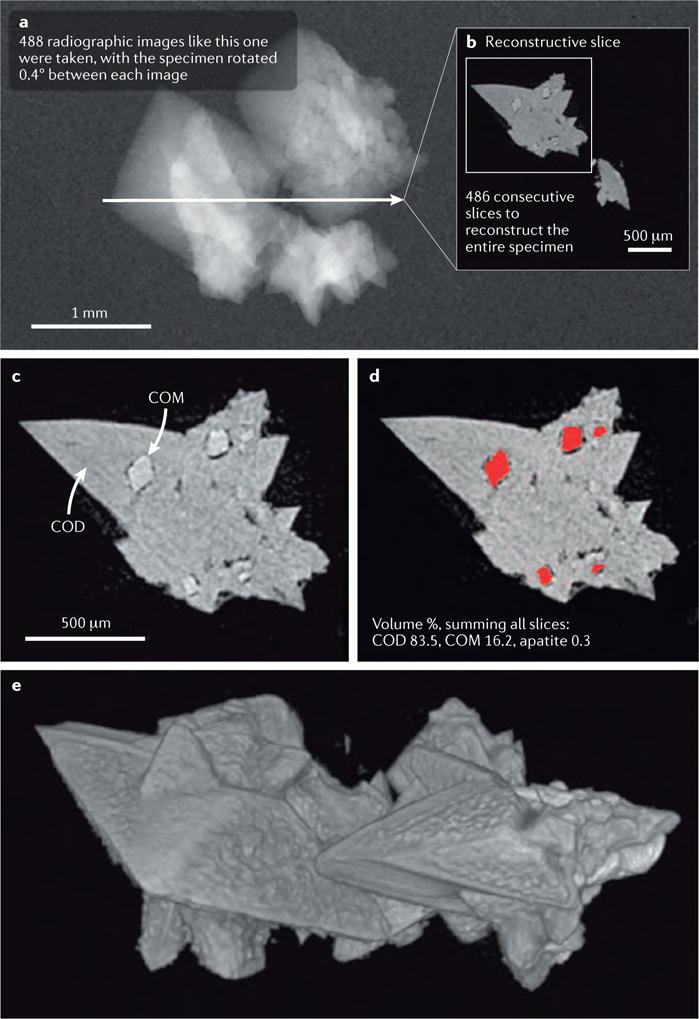
Figure 3. Micro-CT imaging and reconstruction of a stone fragment.

a | First, the specimen is imaged using a radiation source and an x-ray camera, with a small degree of rotation accomplished between consecutive images. In the example shown here, the specimen was rotated 0.4° between each image, for a total rotational range of slightly more than 180°. The computer then used this series of radiographic images to reconstruct the 3D structure of the specimen. b | A single reconstructed slice taken through the specimen depicted in part a. c | A portion of the same slice as depicted in part b; note that the regions of transformation of the calcium oxalate dihydrate (COD) to monohydrate (COM) are quite small, in the order of 100 μm in size, but these can be easily observed. Imaging of transformed regions within COD crystals has also previously been described, but only by physically cutting sections of the crystals65,66. The COM absorbs radiation with a slightly greater avidity than that of COD, therefore the image could be easily segmented to measure the portion of the stone occupied by COM. d | Segmentation of COM. When all image slices are similarly segmented, the volume percentages of the minerals can be easily calculated. e | Surface rendering of the fragment used in this example, note the clarity with which the polyhedral crystals of COD are shown.
