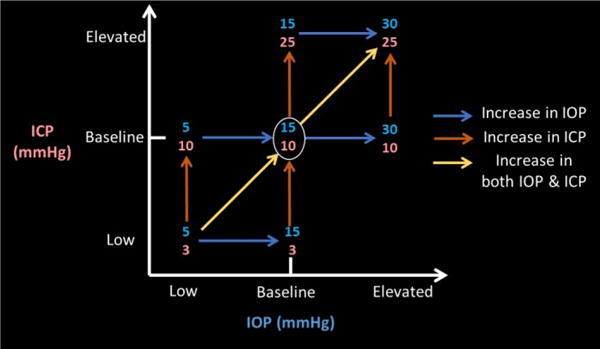
Figure 2.

Experimental pressure combinations. Intraocular (IOP, blue, x-axis) and intracranial (ICP, orange, y-axis) were manipulated to be at low, baseline, or elevated levels. Baseline condition is defined at IOP at 15mmHg and ICP at 10mmHg. Scans from condition pairs were analyzed to determine the effects of pressure changes in the direction of the arrows.
