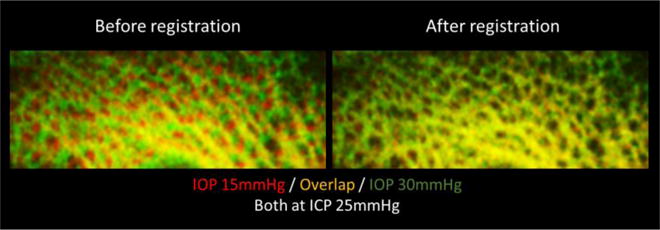
Figure 4.

Example green/yellow/red plots showing no match before registration (Left column), but excellent match after registration (Right column) with our digital image correlation technique. Note how variations in image intensity between scans cause local red and green “hot-spots”.
