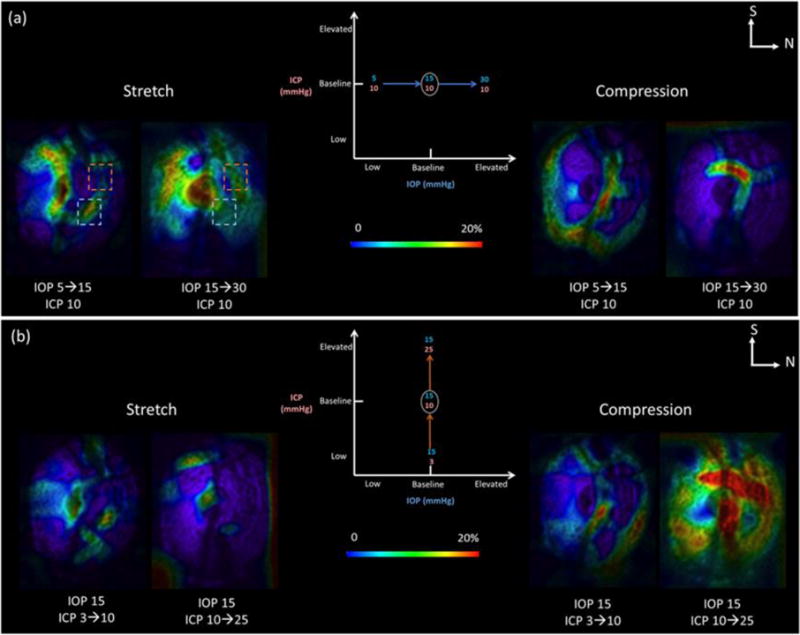
Figure 5.

Effects of increases in IOP at baseline ICP (a) or in ICP at baseline IOP (b). For either IOP or ICP, three scans were analyzed at low, baseline and elevated pressures. This produced two maps of pressure change: from the low to the baseline pressure and between the baseline and the elevated pressure. We computed maps of local pressure-induced tissue stretch and compression. In this figure we show C-mode cross sections at the lamina cribrosa colored according to the magnitude of tissue stretch (Left) and compression (Right). The pressure effects were non-linear (blue rectangle) and non-monotonic (orange rectangle). N: nasal. S: superior.
