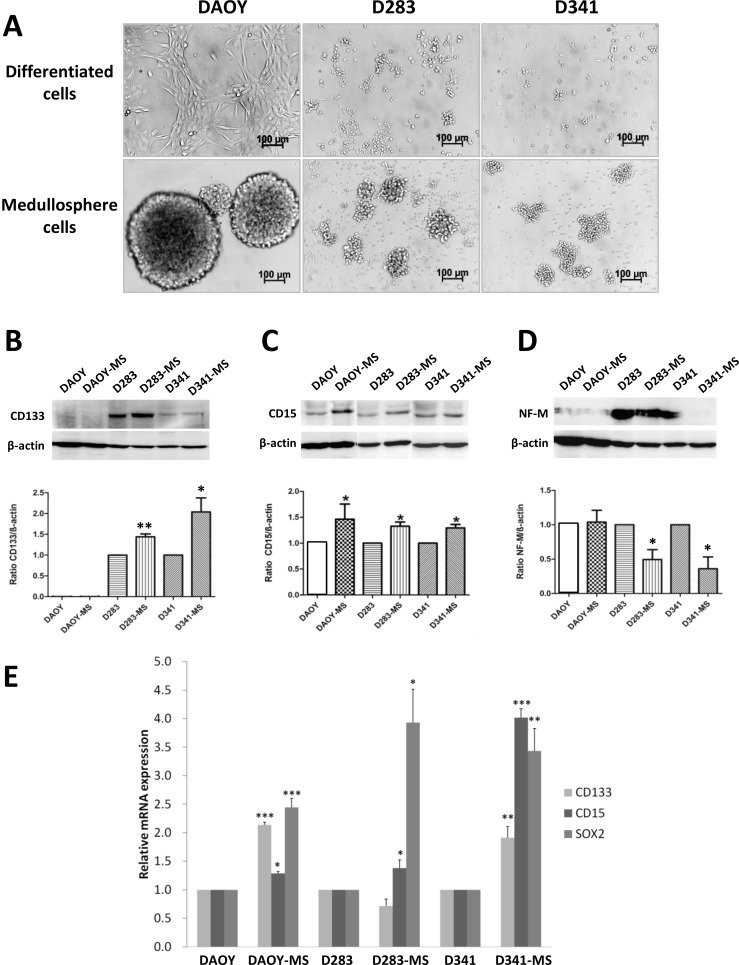
Figure 1. Phenotypic proteins and transcripts expression of MB stem cells models.
(A) Images of medullospheres of MB stem cells from cell lines: DAOY, D283-Med and D341-Med (× 40 magnification, Bars:100 μm). Expression of CD133 (B), CD15 (C) and NF-M (D) between differentiated cells and MB stem cells by Western blot normalized by β-actin expression. (E) Gene expression of phenotypic transcripts of CD133, CD15 and Sox2 of differentiated cells and MB stem cells normalized by RNA pol II expression. *p < 0.05, **p < 0.01, ***p < 0.001, n = 3.

