
Figure 4. Metabolic heat maps representing the differences in the metabolic profile of tumors.
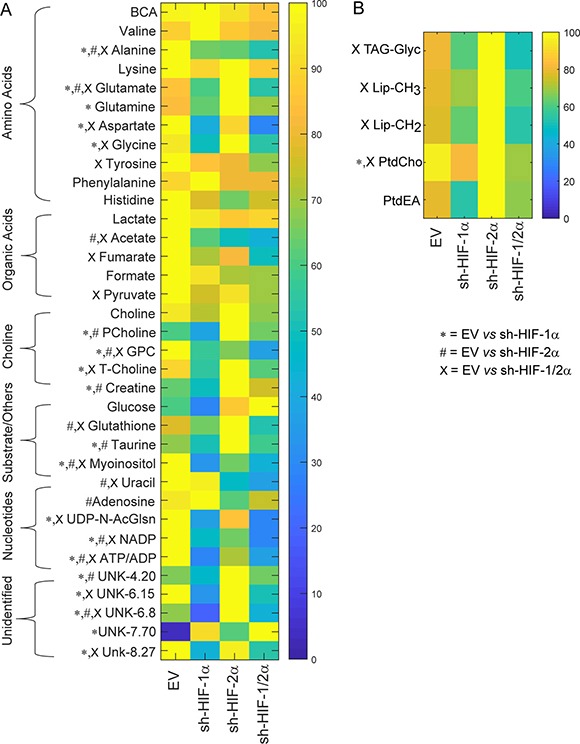
Heat maps were generated from quantitative analysis of high-resolution one dimensional 1H MR spectral data from (A) the aqueous phase and (B) the lipid phase of 231-EV, sh-HIF-1α, sh-HIF-2α and sh-HIF-1/2α tumor extracts. Heat maps were created using MATLAB software (MATLAB R2012b, MathWorks) to visualize the metabolic patterns. Due to the high dynamic range of metabolites, we normalized the highest intensity of a metabolite in each of the four groups to 100%. This normalization provides a dynamic range between 0 - 100%, allowing a better presentation of heat maps. The heat map represents average measurements of multiple replicates per group (231-EV: n = 9, sh-HIF-1α: n = 10, sh-HIF-2α: n = 9, and sh-HIF-1/2α: n = 7). The integral area under the peak was normalized to weight and volume of the sample. TSP dissolved in D2O was used as a quantitative reference in the spectral analysis. Unpaired student’s t-test was applied to measure statistical significance. (*p value < 0.05 for 231-EV vs sh-HIF-1α; #p value < 0.05 for 231-EV vs sh-HIF-2α; xp value ≤ 0.05 for 231-EV vs sh-HIF-1/2α). UDP-N-AcGlsn: UDP-N-Acetyl-Glucosamine.