
Figure 5.
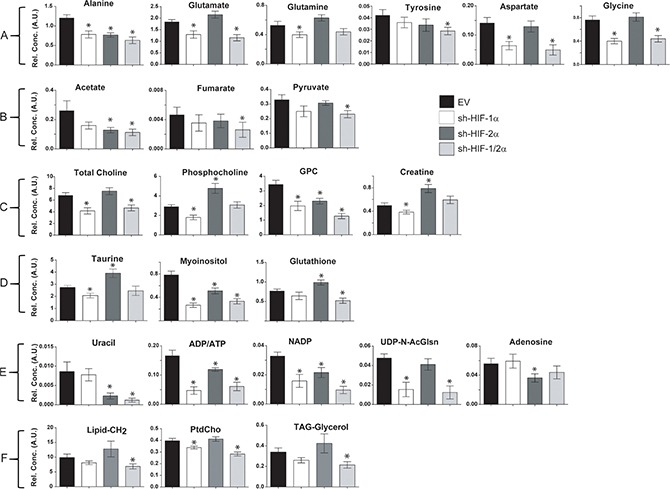
Bar plots of significantly different concentrations in arbitrary units (A.U.) detected in (A) amino acids, (B) organic acids, (C) choline metabolites, (D) substrates/other, (E) nucleotides, and (F) lipids in 231-EV, sh-HIF-1α, sh-HIF-2α and sh-HIF-1/2α tumors. Values represent mean ± SEM. *p value ≤ 0.05 compared to 231-EV.