
Figure 6. Venn diagram summarizing the commonality and directionality of changes in sh-HIF-1α (red), sh-HIF-2α (green), and both sh-HIF-1/2α (blue) tumors compared to 231-EV tumors, created using web based software Venny 2.1.0 (BioinfoGP at Spanish National Biotechnology Centre (CNB)-CSIC).
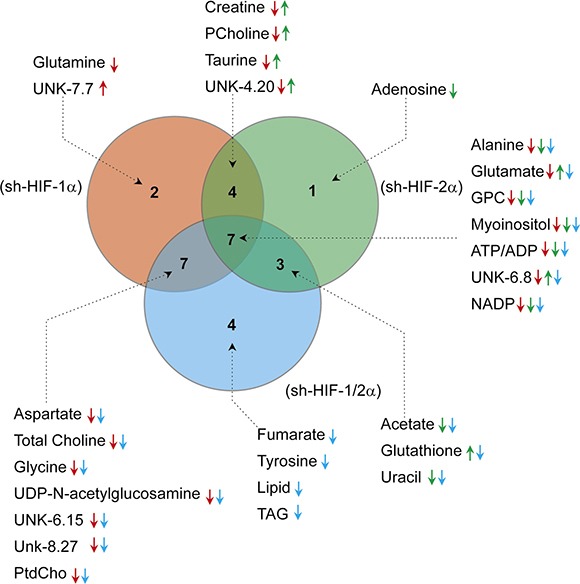
Numbers of metabolites highlighted in each circle were specific to the respective silenced group. Metabolites that changed in both groups are highlighted in the corresponding overlapping region. The metabolites are listed together with arrows to represent significant increase (up) or decrease (down) in the corresponding groups (red: 231-EV vs sh-HIF-1α; green: 231-EV vs sh-HIF-2α; blue: 231-EV vs sh-HIF-1/2α).