
Figure 7.
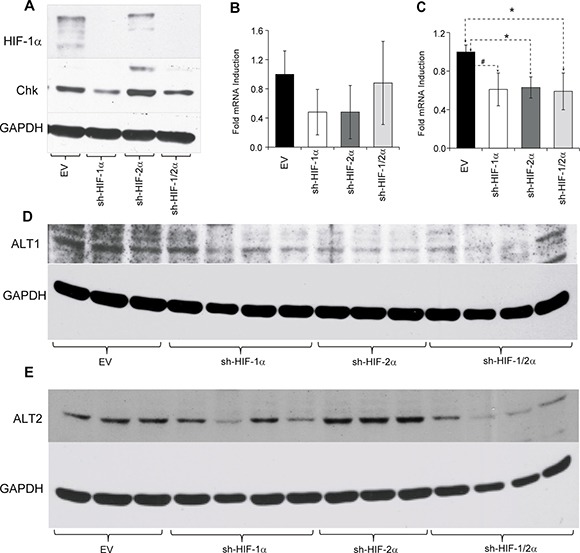
(A) Representative western blots showing choline kinase (Chk) expression in tumors derived from empty vector and HIF-silenced cells. Bar plots represents (B) alanine aminotransferase 1 (ALT1) and (C) alanine aminotransferase 2 (ALT2) mRNA expression levels in tumor xenografts. Values represent mean fold induction ± SEM of the ∆Ct values from 231-EV (n = 9), sh-HIF-1α (n = 10), sh-HIF-2α (n = 8) and sh-HIF-1/2α (n = 6) tumors. (D) and (E) Western blots of ALT1 and ALT2 expression in tumors derived from empty vector and HIF-silenced cells. GAPDH was used as a loading control in the western blots. # p = 0.08; p < 0.05.