
Figure 2. Visualization of the results of SPM.
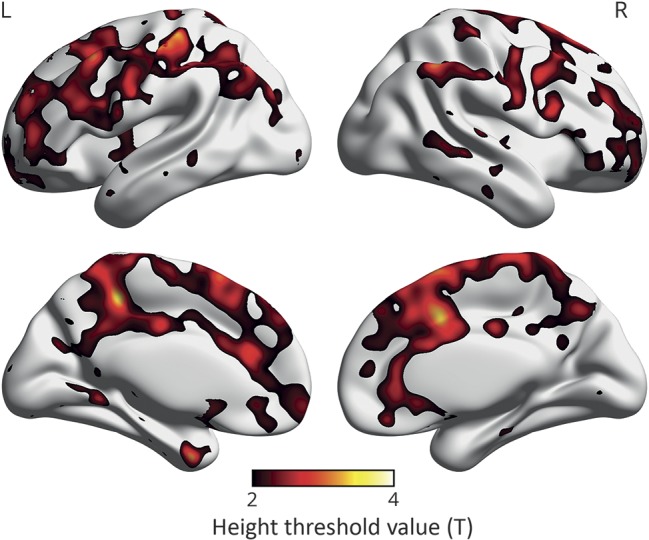
Voxel-by-voxel SPM analysis of [11C]PiB uptake showing regions where individuals with insulin resistance 15 years before the PET scans had higher [11C]PiB uptake than the control group. The color scale starts from the height threshold (T) 2.0, derived from SPM analysis adjusted for age, time from baseline to PiB scan, sex, and years of education, and indicating the difference between IR− and IR+ groups for all regions shown in color in the image; yellow is the most significant (p < 0.025 when T = 2.0, uncorrected for multiple comparisons). n = 60. IR = insulin resistance; PiB = Pittsburgh compound B; SPM = statistical parametric mapping.