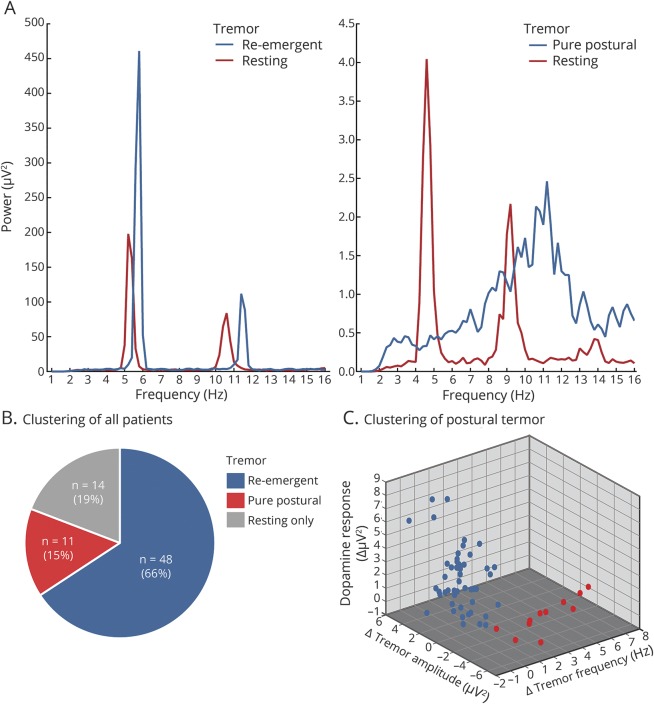
Figure 1. Example power spectra and participant classification.
Power spectrum example of a patient with a re-emergent tremor (left panel in A) and an example of a patient with pure postural tremor (right panel in A; downscaled with factor 3 for illustration purposes). (B) Overview of all patients demonstrating the number of patients without a postural tremor (gray piece) and division of patients with a postural tremor according to the 2-step clustering (blue and red pieces). (C) Values of the variables used for clustering. Blue data points indicate patients from the re-emergent tremor cluster, whereas red indicates patients from the pure postural tremor cluster.

