
Figure 4.
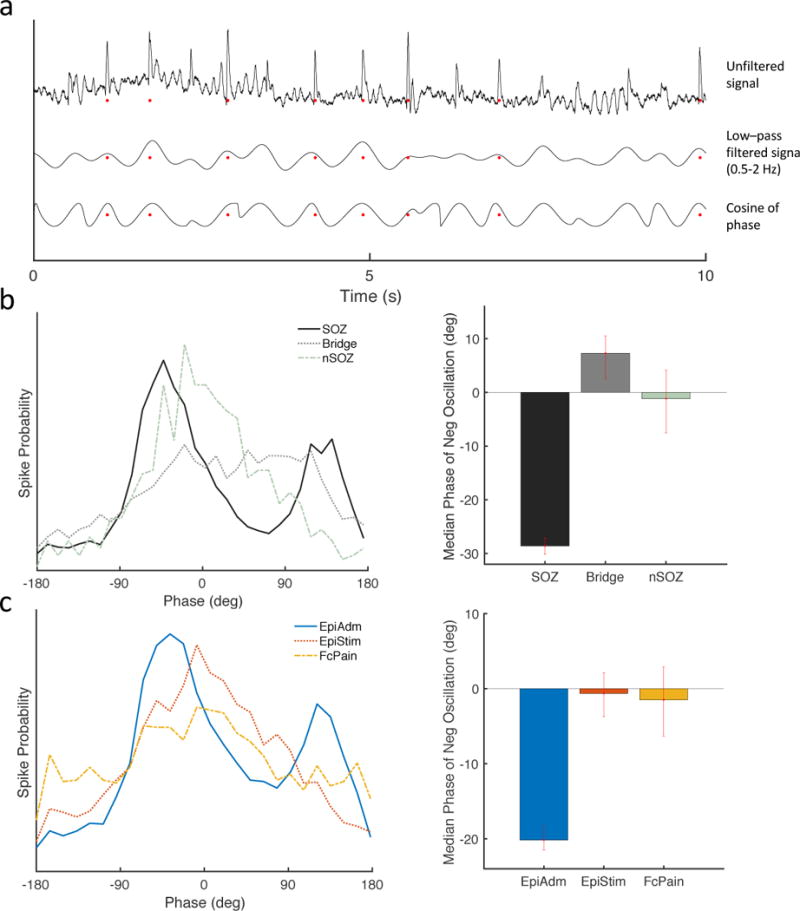
Spikes occur earlier during the negative portion of slow oscillations. (a) Example traces of the unfiltered iEEG signal (top), the signal bandpass filtered at 0.5–2 Hz (middle), and the cosine of the phase (bottom). Red dots represent automatically detected spikes. Negative is upwards, and negative peaks correspond with phase of zero degrees. (b) Spikes in the SOZ occurred earlier (peak at −42 degrees) with respect to the phase of slow wave oscillations (0.5–2 Hz) than spikes in the nSOZ (peak at 20 degrees). Median phases during the negative slow oscillations occurred earlier for the SOZ (n=4,704; −28.6, [−30.1 −27.1]) compared to Bridge (n=1,904, 7.3, [2.4 10.5]) and nSOZ (n=583; −1.2, [−7.5 4.1]). (c) Similarly, spikes in EpiAdm occurred earlier (peak −37 degrees) than spike from EpiStim (peak 8 degrees) or FcPain (peak 8 degrees). Median phases during the negative slow oscillations occurred earlier for the EpiAdm (n=7,191; −20.2, [−21.7 −18.5]) compared to EpiStim (n=1,872; −0.6, [−3.7 2.4]) and to FcPain (n=1,215; −1.5, [−6.5 2.2]). Error bars represent 95% confidence intervals determined by bootstrapping.