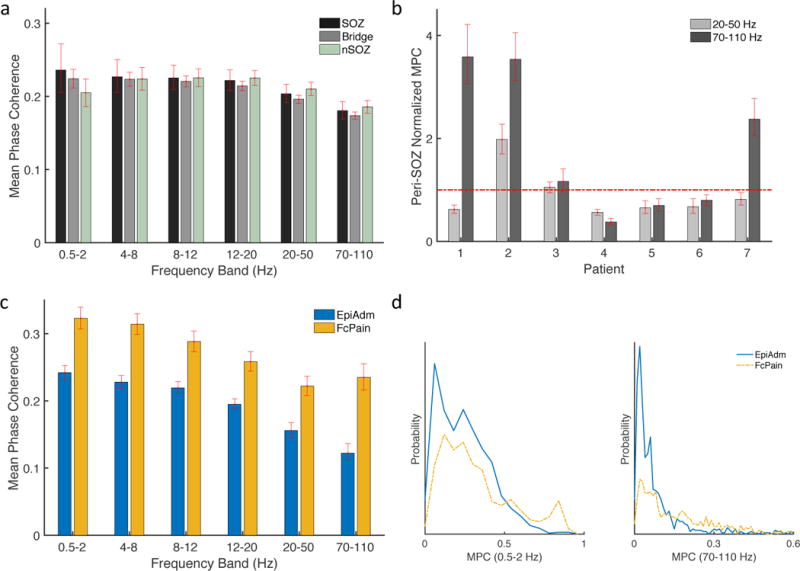
Figure 6.

Mean phase coherence (MPC) for adjacent electrode pairs. (a) MPC was not significantly diffferent for contacts in the nSOZ for frequencies 20–50 and 70–110 Hz. (b) MPC in SOZ and Bridge regions was normalized by MPC for nSOZ contacts. Values less than one signify increased synchrony in nSOZ contacts. (c) MPC was significantly decreased for EpiAdm compared to FcPain for all frequency bands. (d) Probability distributions of MPC values for adjacent contacts for the lowest and highest frequency bands are right-shifted for FcPain compared to EpiAdm. Error bars represent 95% confidence intervals determined by bootstrapping.
