
Figure 1.
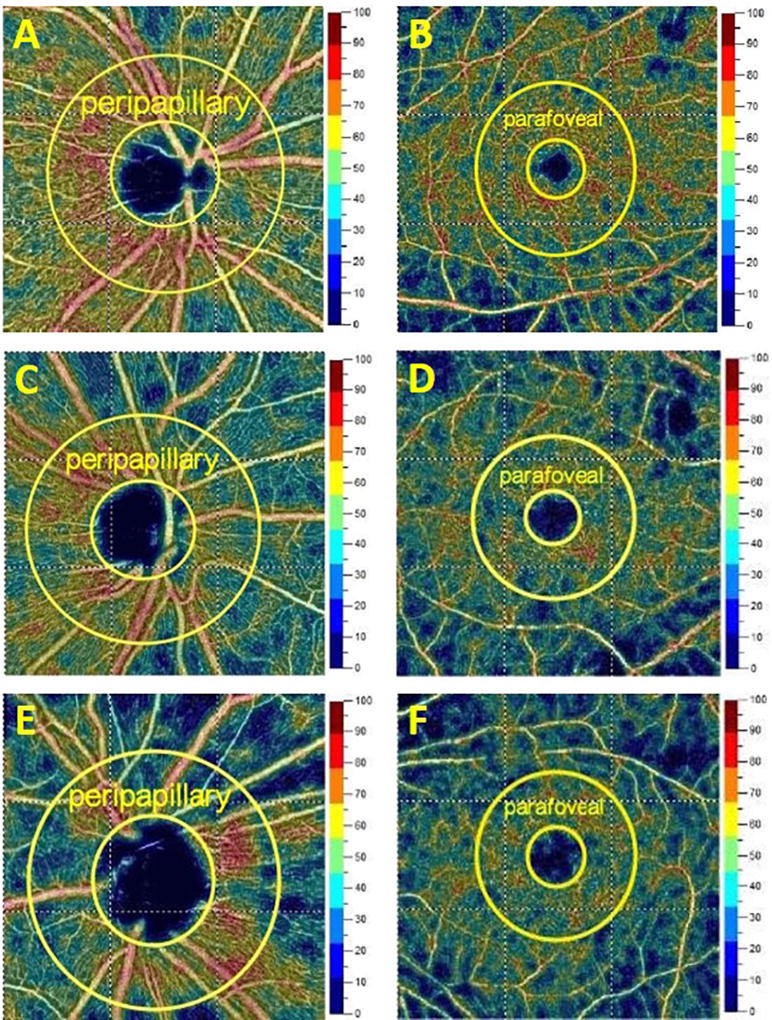
Representative optical coherence tomography angiographic images of the peripapillary and parafoveal areas in healthy eyes (A: peripapillary; B: parafoveal), and in eyes with primary angle closure glaucoma and well-controlled intraocular pressure (C: peripapillary; D: parafoveal) or not-well-controlled intraocular pressure (E: peripapillary; F: parafoveal). IOP, intraocular pressure; PACG, primary angle closure glaucoma.