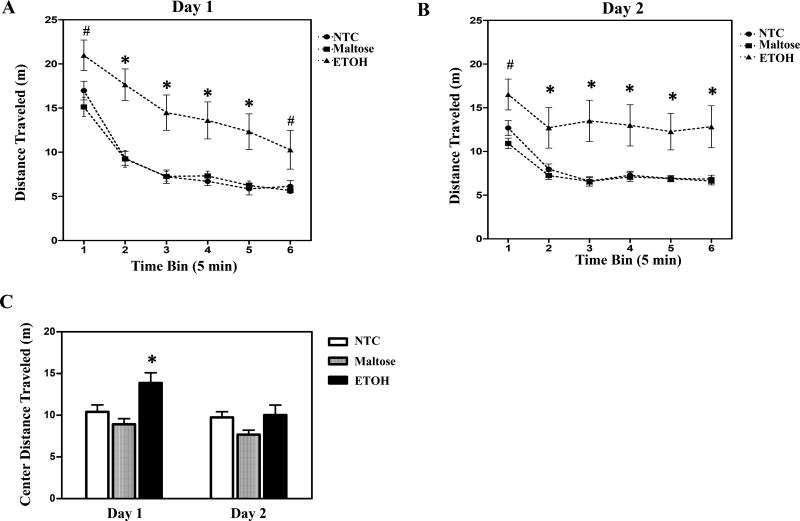
Figure 2. Open field test.
Neonatal ETOH exposure resulted in hyperactivity on both day1 (A) and day 2 (B). Data is presented, collapsed across sex, as distance travelled (mean ± S.E.M.). ETOH exposed offspring also traveled a greater distance in the center relative to controls on the first day of testing (C). Data is presented, collapsed across sex and the 30-min test session for each day (mean + S.E.M.). *indicates a significant difference from both NTC and maltose-treated controls. (#) indicates a significant difference from maltose-treated animals. N’s = 8 – 9 litters per treatment group. p’s < 0.05.

