
Figure 6. pERK and PEA-15 expression patterns and functional interactions.
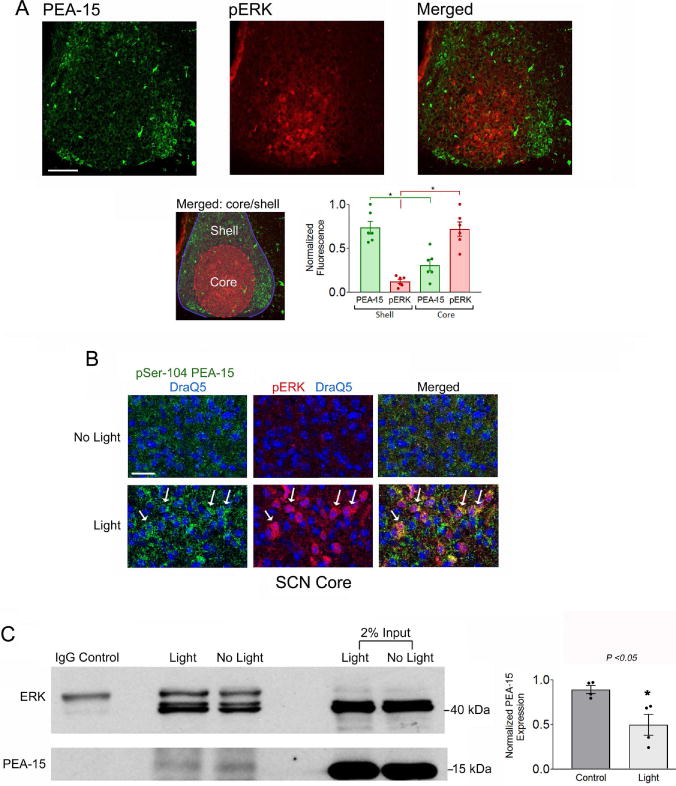
A) Top panels: Mice were dark-adapted for two days, pulsed with light (30 seconds, 100 lux) at CT15 and the SCN tissue was immunolabeled for PEA-15 and phospho-ERK (pERK). Light trigged marked ERK activation within the SCN core, a region that exhibited low levels of PEA-15, relative to the shell region. Bar = 75 microns. Bottom left panel: the merged image was color-coded to delineate the two noted regions; Red shading corresponds to the core region; the blue outline and shading defines the shell region. Bottom right panel: Densitometric analysis of PEA-15 and pERK expression in the core and shell regions of the SCN: data were analyzed by Student’s t-test. *: p < 0.0001. B) Representative confocal images of pSer-104 PEA-15 (green channel), pERK (red channel) and DraQ5 (blue channel) from the SCN core region. Relative to the no light condition, light triggered a marked increase in PEA-15 phosphorylation and ERK activation. Arrows denote cells with relatively high levels of pSer-104 PEA-15 and pERK. Bar = 40 microns. C) Left panel: Co-immunoprecipitation of SCN tissue from control and light-treated animals sacrificed at CT15. Total ERK was immunoprecipitated and probed via Western blotting for ERK and PEA-15. Relative to the control condition, the amount of immunoprecipitated PEA- 15 was reduced following light treatment. Tissue was pooled from 8 SCN samples for each condition, and the experimental results were performed using four separate trials. Right panel: Quantitative analysis of PEA-15 expression in the immunoprecipitated lysates from control and light-treated mice. Data were averaged from quadruplicate determinations and presented as normalized values and were analyzed by Student’s t-test *: p < 0.05.