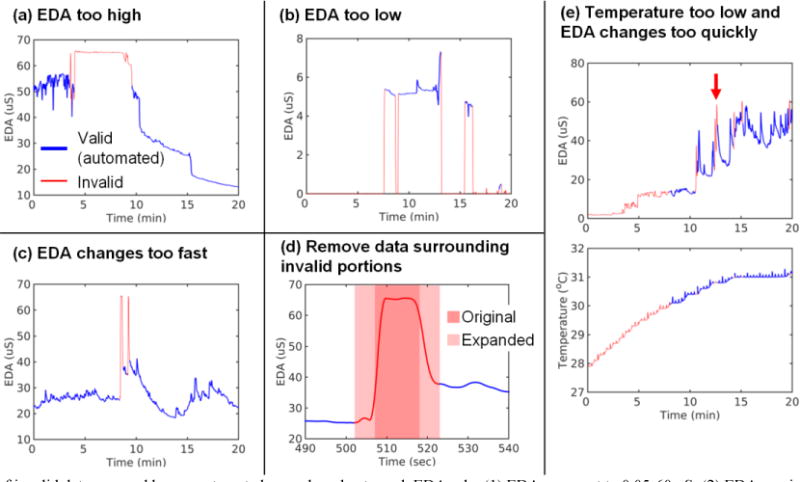
Fig. 3.

Examples of invalid data assessed by our automated procedure due to each EDA rule: (1) EDA range set to 0.05–60 μS; (2) EDA maximum slope set to ±10 μS/sec; (3) temperature range set to 30–40°C; and (4) transition range set to any data within 5 sec. Valid data are blue and invalid data are red. In panel (d), the dark red shaded portion shows data originally removed because EDA level and slope were too high. The light red shaded portion shows that region expanded to a 10-sec wide window (Rule 4 in Table 1) to account for transition effects surrounding the artifact. In panel (e), the red arrow indicates a region where the automated procedure removed data that appears to be valid. The data shown were subject to our low-pass filter.
