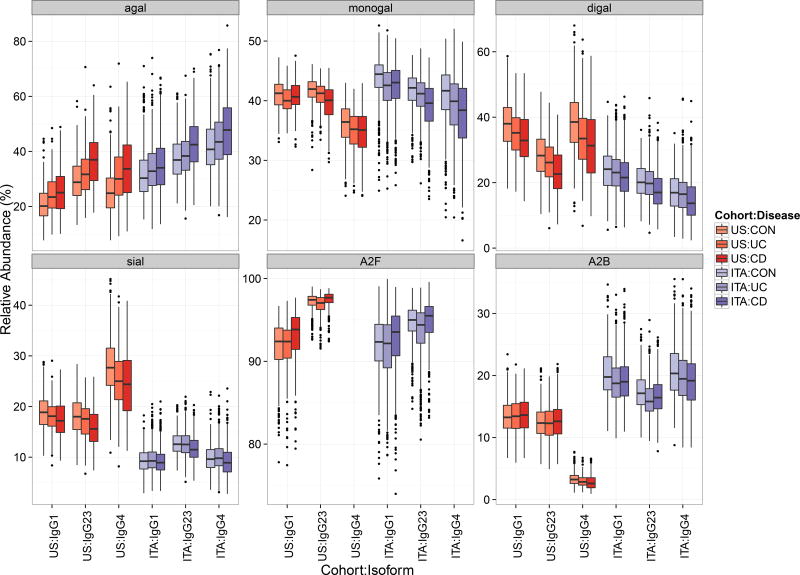
Figure 2. Differences in derived IgG Fc-glycan traits between HC, UC and CD for all IgG subclasses in both cohorts.
Differences in derived glycan traits for all IgG subclasses between HC, UC and CD are shown separately for the US (red) and ITA (blue) cohort. Data are shown as box and whiskers plots. Each box represents the 25th to 75th percentiles (IQR). Lines inside the boxes represent the median. The whiskers represent the lowest and highest values within the boxes ± 1.5x the IQR. Derived glycan traits are listed in Supp. Table 3.-4. and their glycoforms in Supp. Table 2. Analysis of the differences in glycan traits between UC and HC, CD and HC and UC and CD, were performed using a logistic regression model with age and sex included as additional covariates (Table 2., Supp. Table 6., 8., and 10.).

