
Figure 3. Cell, Tissue, and Biological Function Ontologies Associated with the Statistically Significant Differences of the Serum Proteome.
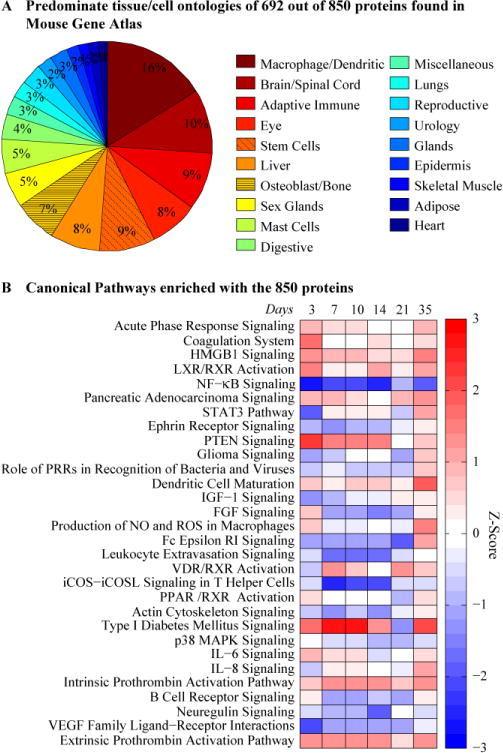
(A) Pie chart representing cell and tissue types associated with ontologies related to proteins in serum. Number of proteins per ontology is listed in Supplemental table 1. Proteins present in multiple ontologies are given a weighted value. (B) Enrichments analysis showing Canonical Pathways for all 850 Proteins. The color represents the z-score (ranging from −3 in blue to +3 in red). The rows are sorted by p-value with most significant at the top.