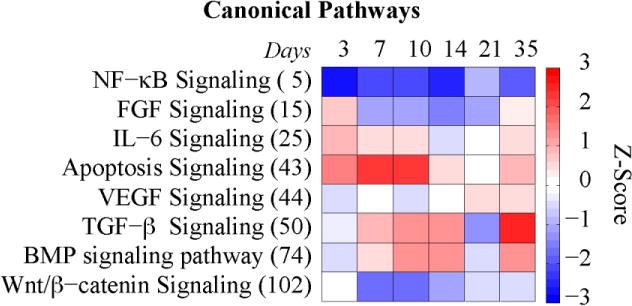
Figure 4. Subset of the Canonical Pathways Relating to Fracture Healing.

The rows are sorted by p-value with most significant at the top (rank is shown in parenthesis). The color represents the z-score (ranging from −3 in blue to +3 in red).

The rows are sorted by p-value with most significant at the top (rank is shown in parenthesis). The color represents the z-score (ranging from −3 in blue to +3 in red).