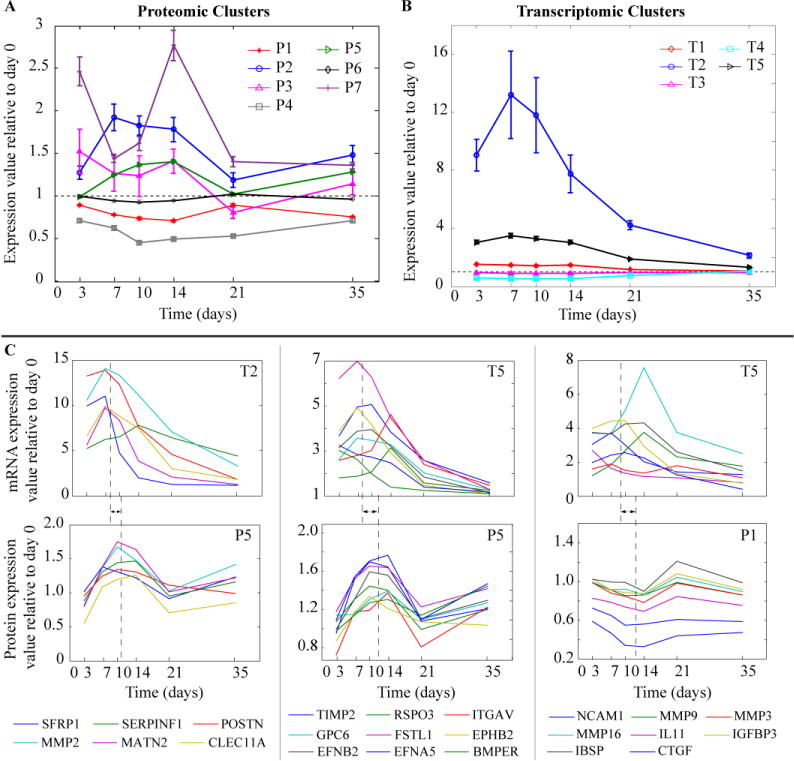
Figure 5. Temporal Clustering and Protein Profiles of the Serum Proteome of Fracture Healing.

Average expression profile (error bars correspond to the standard deviation) for: (A) Proteomic clusters (cluster number indicated with prefix letter P); (B) Transcriptomic clusters (cluster number indicated with prefix letter T); and (C) For a subset of osteoblast related genes/proteins (23 out of 68): (top) mRNA gene expression and (bottom) corresponding protein level profiles. For example, the first column shows the profiles for 6 genes (listed below the subplot) that were in transcriptomic cluster 2 and proteomic cluster 5. The dashed line represents the average peak time for the shown genes and the arrow indicates the difference in the average peak time between mRNA and protein expression.
