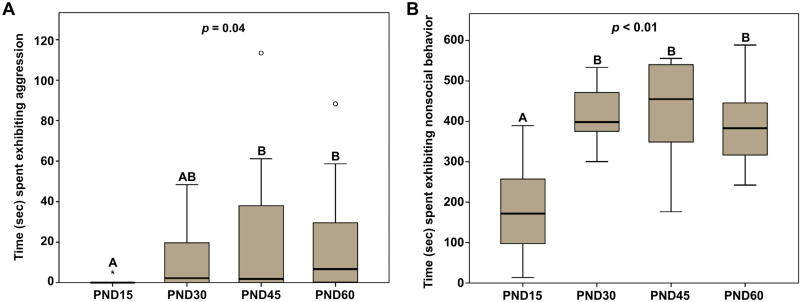
Fig. 4.
(A) Duration of test time (sec) spent exhibiting aggressive behavior with a novel, same-sex conspecific. Pre-weaning (PND15) males spent significantly less time being aggressive than PND45 and PND60, but not PND30, males. (B) Duration of test time (sec) exhibiting nonsocial behavior. Pre-weaning (PND15) males spent significantly less time being nonsocial compared to older males. Box plots show the median (black line), 75th and 25th percentiles (box), and 95% confidence interval (whiskers). ° represents outliers. * represents extreme outliers. Letters above graphs (A, B) indicate statistical similarity.

