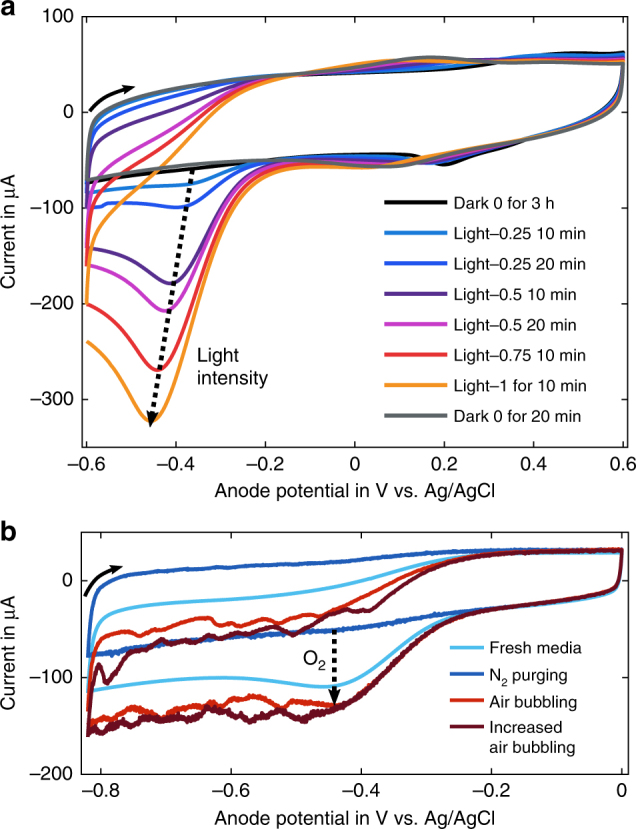
Fig. 7.

Cyclic voltammetry analysis of microporous ITO anodes at a scan rate of 4 mV s−1 with BG11 medium as electrolyte. a Response of the bio-anode (Synechocystis) under exposure to different constant light levels. Light intensity 1 corresponds to a photon flux of 820 µmol m−2 s−1, and the time indicates for how long the light level was applied by the end of the measurement. b Scans of abiotic anodes in the dark. The oxygen content of the electrolyte was varied by purging the electrolyte with nitrogen gas or compressed air
