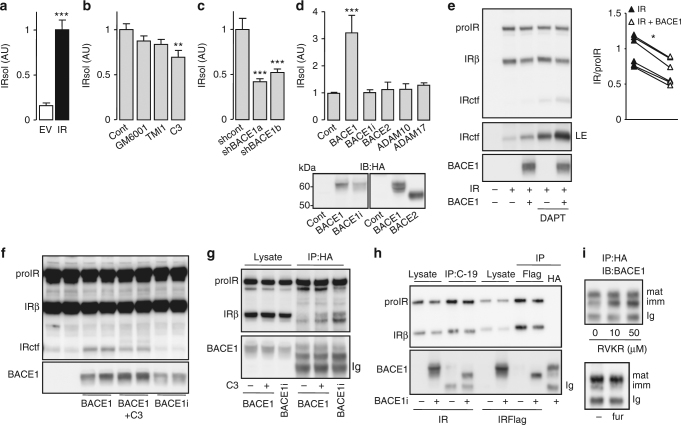
Fig. 2.
BACE1 is involved in IR cleavage. IRsol was measured by ELISA in 24 h conditioned media of a HEK 293 cells transfected with an empty vector (EV) or overexpressing IR. The mean IRsol values from IR overexpressing cells were arbitrarily set at 1. b Cells overexpressing IR and untreated (Cont) or treated with the indicated protease inhibitors (10 μM, 24 h). c Cells overexpressing IR together with BACE1 specific shRNA (shBACE1a, shBACE1b) or a control shRNA (shcont). d Cells transfected with the IR expression vector together with an empty plasmid (Cont), BACE1, inactive BACE1 (BACE1i), BACE2, ADAM10, or ADAM17. Expression of BACE1 and BACE2 were confirmed by immunoblot, using HA antibody (lower panel). e Cells transfected with combinations of IR and BACE1 expression vectors were treated or not with DAPT, then IR and BACE1 were detected by immunoblot. LE indicates a long exposure of the immunoblot. The graph shows the ratios IR/proIR obtained from the quantification of six independent experiments; data from the same experiment are connected by a line. f Cells overexpressing IR and BACE1 or inactive BACE1 (BACE1i) were treated with the BACE1 inhibitor (C3) then IR and BACE1 were detected by immunoblot. g Cells were treated as f, then BACE1 was immunoprecipitated (IP) with anti HA antibody and IR, and BACE1 were detected by immunoblot in cell lysates and immunoprecipitated fractions. h Cells were transfected with the indicated combinations of IR, IRFlag, and BACE1i expression vectors, then overexpressed proteins were immunoprecipitated using C-19, FlagM2 (Flag) and HA antibodies, respectively, and detected by immunoblots. i BACE1 overexpressing cells treated with proprotein convertase inhibitor dec-RVKR-cmk (RVKR; 24 h; upper panel) or cells overexpressing BACE1 without (−) of with furin (fur; lower panel) were lyzed then BACE1 was immunoprecipitated and detected by immunoblot. Positions of the heavy chain of the precipitating antibody (Ig), immature (imm) and mature (mat) BACE1 are indicated. Data are means ± s.d. Statistical analyses were made using unpaired t-test (a, e) or ANOVA followed by Dunnett’s test (b–d); **p < 0.01; ***p < 0.001

