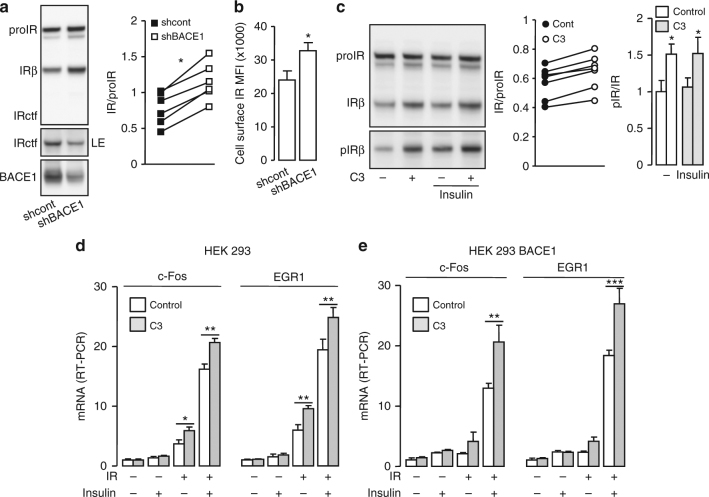
Fig. 3.
BACE1 regulates the amount of cell surface IR. a HEK 293 cells, stably expressing BACE1, were co-transfected with IR expression vector and control shRNA (shcont) or BACE1 specific shRNA (shBACE1) then IR and BACE1 were analyzed by immunoblot. LE indicates a long exposure of the immunoblot. The graph shows the ratio IR/proIR obtained from the quantification of six independent experiments; data from the same experiment are connected by a line. b IR expression was measured by flow cytometry at the surface of cells, stably expressing BACE1 and co-transfected with the IR expression vector associated with control shRNA (shcont) or BACE1 specific shRNA (shBACE1). The median fluorescence intensity (MFI) corrected for the value obtained with cells transfected with the empty vector is shown. c Cells expressing BACE1 were transfected with IR expression vector and treated overnight with the BACE1 inhibitor (C3; 20 μM) in the absence of serum, then stimulated with insulin (5 nM, 5 min) and IR, and phospho IR (pIRβ) were analyzed by immunoblot. The graphs show the ratios IR/proIR and pIR/IR obtained from the quantification of seven and six independent experiments, respectively. Native HEK 293 cells (d) or HEK 293 cells expressing BACE1 (e) were transfected with IR coding vector (+) or with empty vector (−), treated with BACE1 inhibitor (C3; 20 μM; gray columns), serum deprived for 20 h and stimulated with insulin (5 nM, 45 min; +). Levels of c-Fos and Egr1 mRNA were measured by RT-PCR and expressed as fold over the situation without IR overexpression nor insulin stimulation. Data are means ± s.d. Statistical analyses were made using unpaired t-test (a–c) and ANOVA followed by Bonferroni’s test (e); *p < 0.05; **p < 0.01

