Fig. 4.
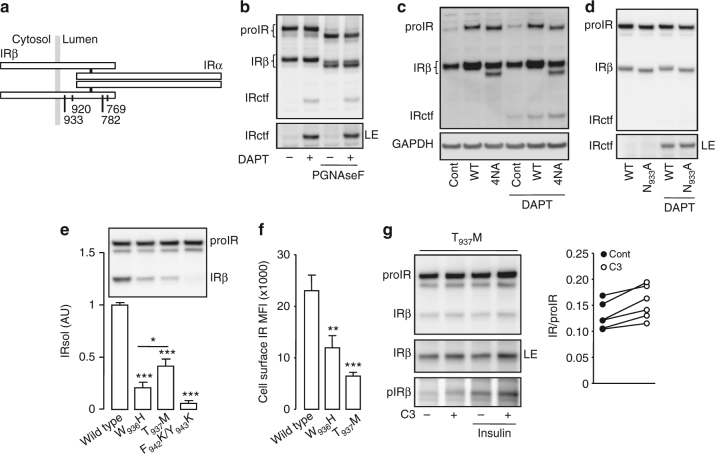
Identification of the IR cleavage region. a Schematic representation of IR positioning the N-glycosylation sites in the β-subunit. b HEK 293 cells were transfected and treated as described in Fig. 1b. Where indicated cell lysates were in vitro deglycosylated by PGNaseF. c CHO cells were transfected with an empty plasmid (Cont), an IR expression vector (WT) or with a plasmid expressing a mutated form of IR that cannot be glycosylated on its β-subunit (4NA), then treated with DAPT. d HEK 293 cells were transfected with an IR expression vector (WT) or with a plasmid expressing a mutated form of IR that cannot be glycosylated on the position 933 (N933A), then treated with DAPT. HEK 293 cells expressing BACE1 were transfected with wild-type IR or the indicated mutated forms of IR, then the IRsol accumulated in the conditioned media was measured by ELISA, and cellular expression of IR was analyzed by immunoblot (e), cell surface expression of IR was measured by flow cytometry (f). g Cells were treated as in Fig. 3c then IR and phospho IR (pIRβ) were detected by immunoblot. LE indicates a long exposure of the immunoblot. The graph shows the ratios IR/proIR obtained from the quantification of six independent experiments. Data are means ± s.d. Statistical analyses were made using ANOVA, followed by Bonferonni’s test (e, f) or unpaired t-test (g). *p < 0.05; **p < 0.01; ***p < 0.001

