Fig. 5.
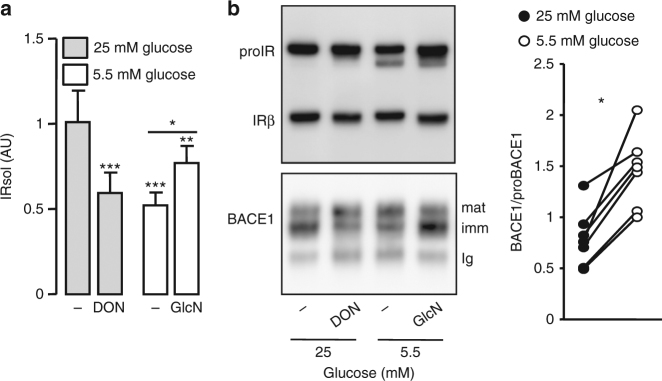
Effect of glucose on IR cleavage and BACE1 expression. HEK 293 cells expressing IR and BACE1 were incubated for 24 h in media containing the indicated glucose concentrations, in the absence (−) or presence of deoxynorleucine (DON; 5 mM) or glucosamine (GlcN; 1 mM) then: a IRsol accumulated in the media was measured by ELISA; b IR and BACE1 were analyzed by immunoblot in total cell lysate or after BACE1 immunoprecipitation, respectively. Positions of the heavy chain of the precipitating antibody (Ig), immature (imm), and mature (mat) BACE1 are indicated. The graph shows the ratios BACE1/proBACE1 obtained from the quantification of seven different experiments; data from the same experiment are connected by a line. Data are means ± s.d. Statistical analyses were made using ANOVA, followed by Bonferonni’s test (a) and unpaired t-test (b). *p < 0.05; ***p < 0.001

