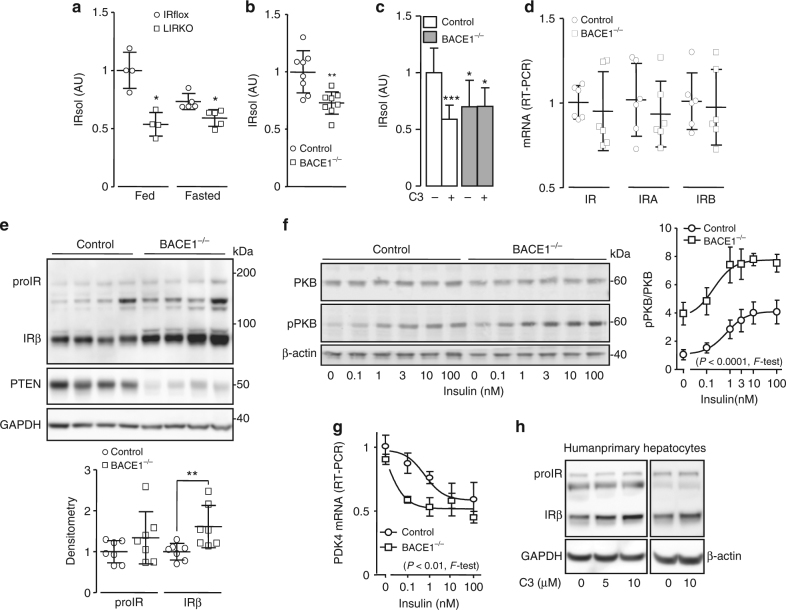
Fig. 6.
In vivo cleavage of IR by BACE1. IRsol was measured in the plasma from a liver-specific IR knockout mice (LIRKO; fed n = 4; fasted n = 5)and their floxed control (IRflox; fed n = 4; fasted n = 5), b BACE1−/− mice (n = 8) and their control littermates (n = 8). c IRsol was measured in the conditioned media from control and BACE1−/− liver explants treated or not with the BACE1 inhibitor (C3). d Levels of IR, IRA, and IRB mRNA were measured by RT-PCR in control and BACE1−/− livers. e Levels of IR, PTEN, and GAPDH (loading control) were analyzed by immunoblot in control and BACE1−/− livers, a densitometric analysis of the proIR and IRβ bands normalized to GAPDH was performed (below the blot), values are expressed as fold over the means of the wild-type mice. f Primary hepatocytes isolated form control (n = 4) and BACE1−/− (n = 3) mice were stimulated for 10 min with the indicated concentration of insulin. A representative immunoblot of insulin-stimulated phosphorylation of PKB at Ser473 is shown. The curves on the right of the immunoblot are the normalized means ± s.e.m of the immunoblots (both curves differed significantly, p < 0.0001, F-test). g mRNA levels of PDK4 were measured by RT-PCR in control and BACE1−/− primary hepatocytes stimulated for 6 h with the indicated concentrations of insulin (both curves differed significantly, p < 0.01, F-test). h Human primary hepatocytes (two different preparations) were incubated for 40 h in the presence of the indicated concentrations of BACE1 inhibitor (C3), then IR and GAPDH or actin (taken as loading controls) were analyzed by immunoblot. Data are means ± s.d. Statistical analyses was made using Mann–Withney (a), unpaired t-test (b, d, e), ANOVA followed by Dunnett’s test (c) or F-test (f, g) *p < 0.05; **p < 0.01; ***p < 0.001

